. 2015 Mar 18;10(3):e0118392.
doi: 10.1371/journal.pone.0118392. eCollection 2015.

Novel R pipeline for analyzing Biolog Phenotypic MicroArray data

Affiliations

Novel R pipeline for analyzing Biolog Phenotypic MicroArray data

Minna Vehkala et al. PLoS One. .

Abstract

Data produced by Biolog Phenotype MicroArrays are longitudinal measurements of cells' respiration on distinct substrates. We introduce a three-step pipeline to analyze phenotypic microarray data with novel procedures for grouping, normalization and effect identification. Grouping and normalization are standard problems in the analysis of phenotype microarrays defined as categorizing bacterial responses into active and non-active, and removing systematic errors from the experimental data, respectively. We expand existing solutions by introducing an important assumption that active and non-active bacteria manifest completely different metabolism and thus should be treated separately. Effect identification, in turn, provides new insights into detecting differing respiration patterns between experimental conditions, e.g. between different combinations of strains and temperatures, as not only the main effects but also their interactions can be evaluated. In the effect identification, the multilevel data are effectively processed by a hierarchical model in the Bayesian framework. The pipeline is tested on a data set of 12 phenotypic plates with bacterium Yersinia enterocolitica. Our pipeline is implemented in R language on the top of opm R package and is freely available for research purposes.


Conflict of interest statement

Competing Interests: The authors have declared that no competing interests exist.

Figures

Fig 1
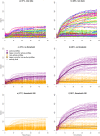
Fig 1. Grouping of PM profiles.
Metabolic profiles of Yersinia enterocolitica, strain 8081c, plate PM01, at two different temperatures: 37°C (panels a, c, e) and 28°C (panels b, d, f). Panels (a) and (b) present the raw data. Each line represents the metabolic signals observed in a single well. Time in hours and the strength of the metabolic signals are represented on the x- and y-axes, respectively. Grouping separates active profiles from the non-active ones by using the EM algorithm. Panels (c) and (d) present the grouped data when no threshold is applied. Active profiles are shown in purple and non-active in orange. Base curves illustrating the average patterns of the two groups are highlighted. The EM algorithm is unable to handle the array with all non-active profiles (panel c), as it always identifies two clusters. Panels (e) and (f) present the data grouped by applying a threshold of 150 (shown as the grey horizontal line). The array with only non-active profiles is successfully identified (panel e), while the grouping on the other array stays almost unaffected (panel f).
Fig 2
Fig 2. Normalization of PM profiles.
Metabolic profiles of three replicates of Yersinia enterocolitica, strain 8081c, plate PM01, at temperature 37°C. Only the profiles classified active are shown. (a) Raw data. Time in hours and the observed metabolic signals are represented on the x- and y-axes, respectively. The first replicate (red lines) shows persistently stronger signals than the second replicate (blue lines). The third replicate (green lines) shows weaker signals than the first two. The negative controls do not indicate the metabolic signals to differ between the replicated arrays (black lines). (b) Base curves fitted into the raw data. Base curves emphasize the differences between the replicates. (c) Normalized data. The second replicate is used as a reference. Normalization is performed based on the non-stabilized grouping. (d) Base curves of the normalized data.
Fig 3
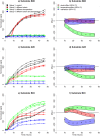
Fig 3. Effect identification of PM profiles.
Panel (a) shows metabolisms of the bacterium Yersinia enterocolitica in substrate B08, panel (c) in substrate A05 and panel (e) in substrate B03. Experiments are performed under four different experimental conditions which are represented by different colours. Measurements under each experimental condition are replicated three times. Time in hours and the normalized metabolic signals are represented on the x- and y-axes, respectively. A line or logistic curve is fitted to each profile according to its activity status. The dots illustrate thinned sequences of the fitted values. Three effects are of interest: main effects for strain and temperature, and their interaction. Effects are estimated as the mean values of Markov chains produced by a variance analysis model. Panels (b), (d) and (f) show the estimates of the effects and their 95% Bayesian credibility intervals.

References

    1. Bochner BR, Gadzinski P, Panomitros E (2001) Phenotype microarrays for high-throughput phenotypic testing and assay of gene function. Genome Research 11: 1246–1255. 10.1101/gr.186501 - DOI - PMC - PubMed
    1. Bochner BR (2003) New technologies to assess genotypephenotype relationships. Nature reviews 4: 309–314. 10.1038/nrg1046 - DOI - PubMed
    1. Bochner BR (2008) Global phenotypic characterization of bacteria. FEMS Microbiol Rev 33: 191–205. 10.1111/j.1574-6976.2008.00149.x - DOI - PMC - PubMed
    1. Boccuto L, Chen CF, Pittman AR, Skinner CD, McCartney HJ, et al. (2013) Decreased tryptophan metabolism in patients with autism spectrum disorders. Molecular Autism 4: 1–10. 10.1186/2040-2392-4-16 - DOI - PMC - PubMed
    1. Lee A, Endesfelder D, Rowan A, Walther A, Birkbak N, et al. (2011) Chromosomal instability confers intrinsic multidrug resistance. Cancer Research 71: 1858–1870. 10.1158/0008-5472.CAN-10-3604 - DOI - PMC - PubMed

Publication types