. 2015 Mar 18;7(4):1039-52.
doi: 10.1093/gbe/evv054.

Increased expression of X-linked genes in mammals is associated with a higher stability of transcripts and an increased ribosome density

Affiliations

Increased expression of X-linked genes in mammals is associated with a higher stability of transcripts and an increased ribosome density

Marie-Line Faucillion et al. Genome Biol Evol. .

Abstract

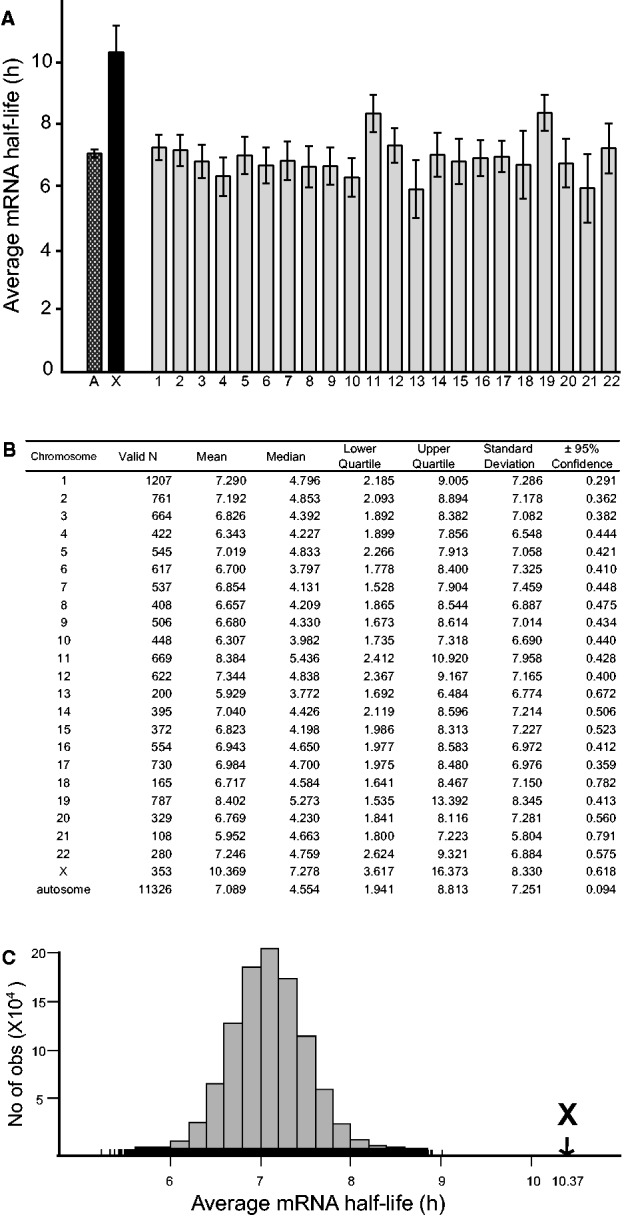
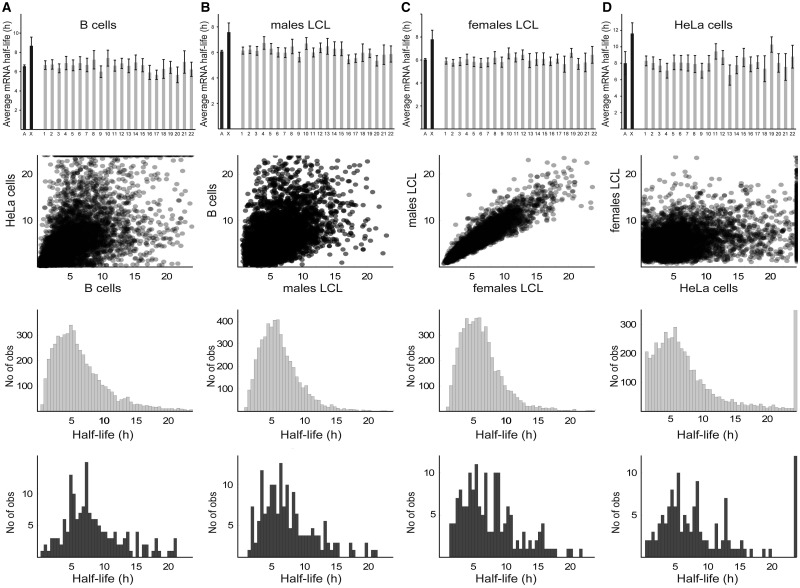
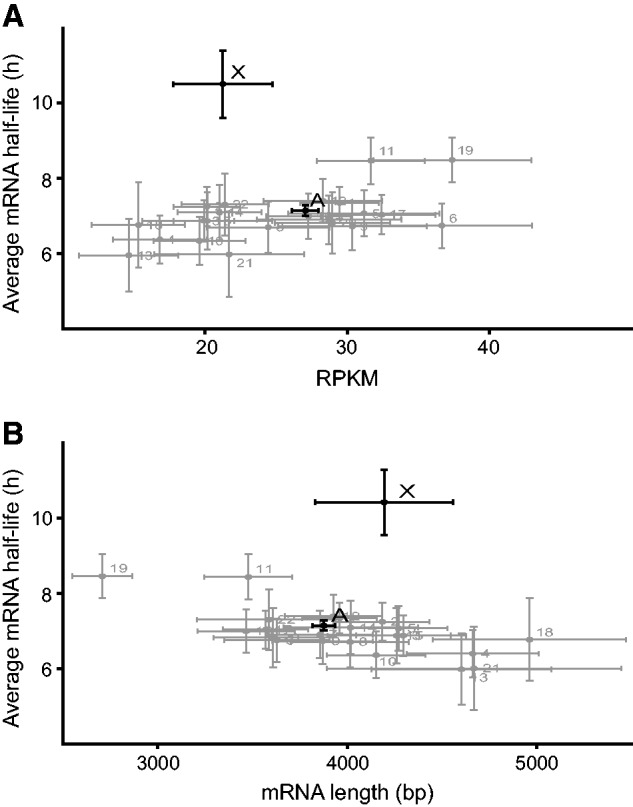
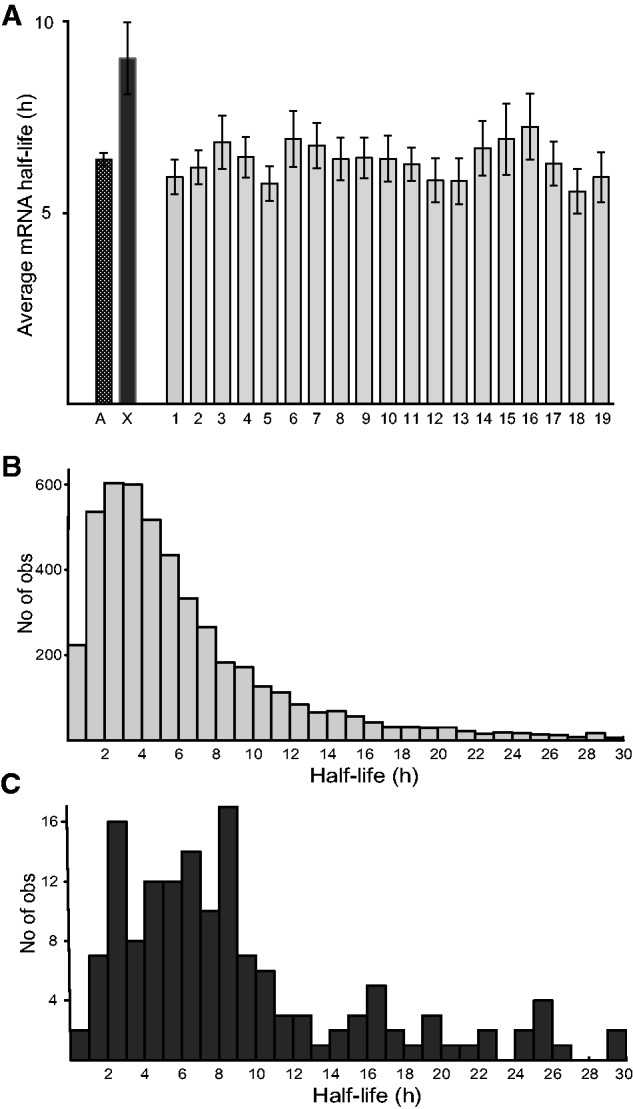
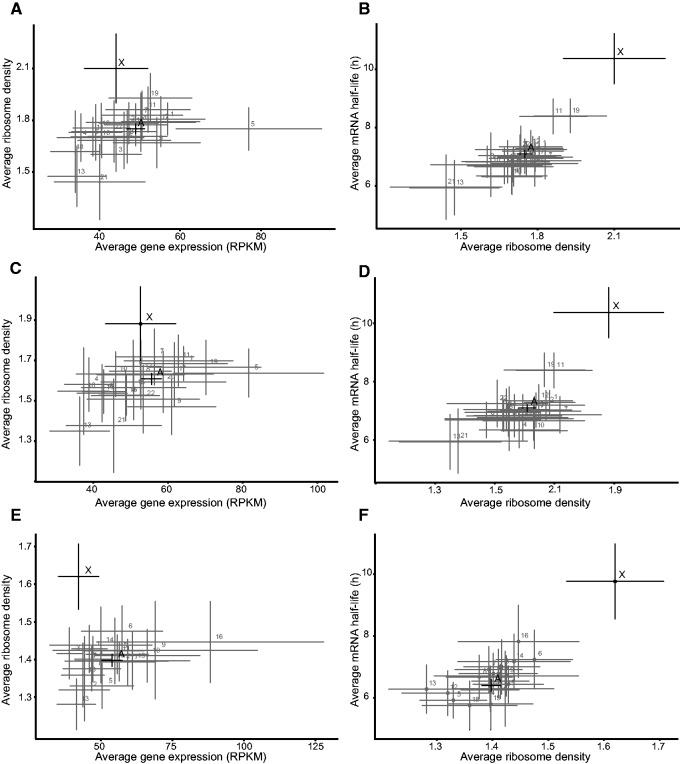
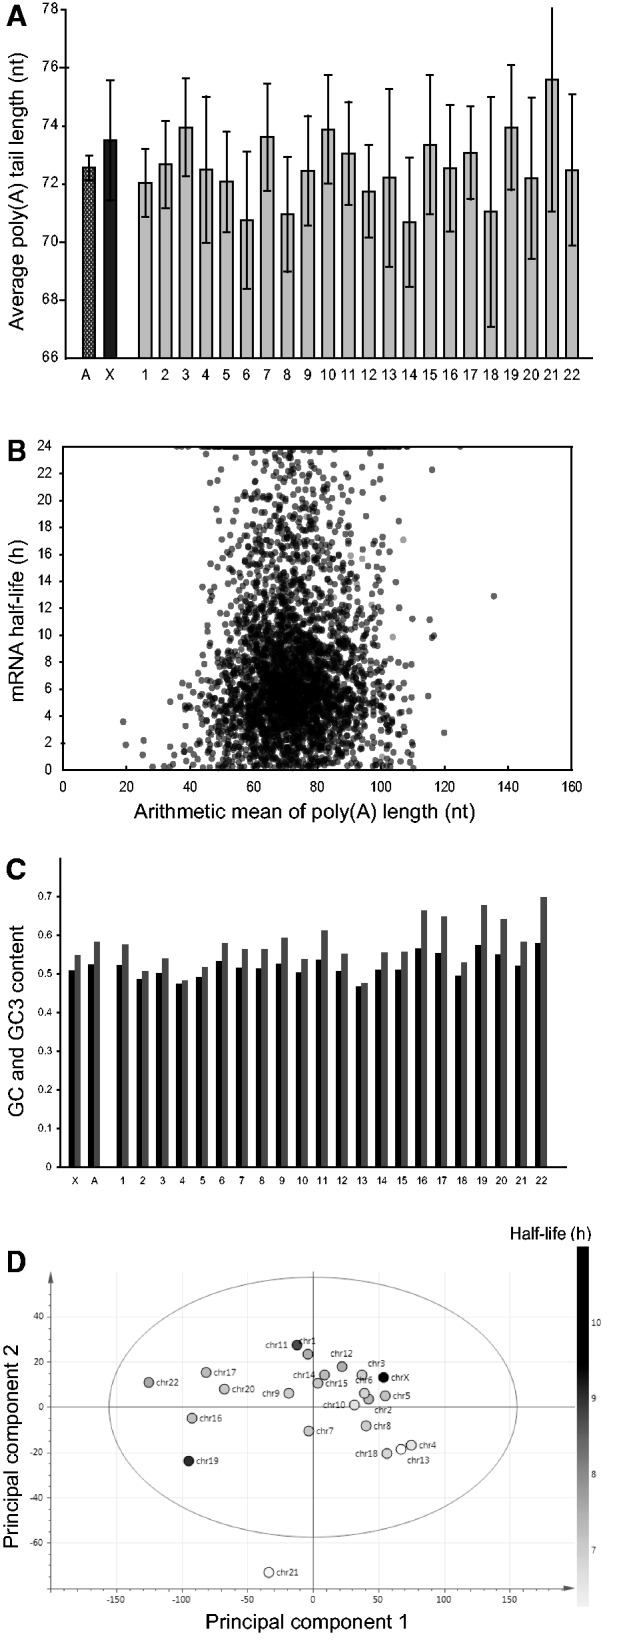
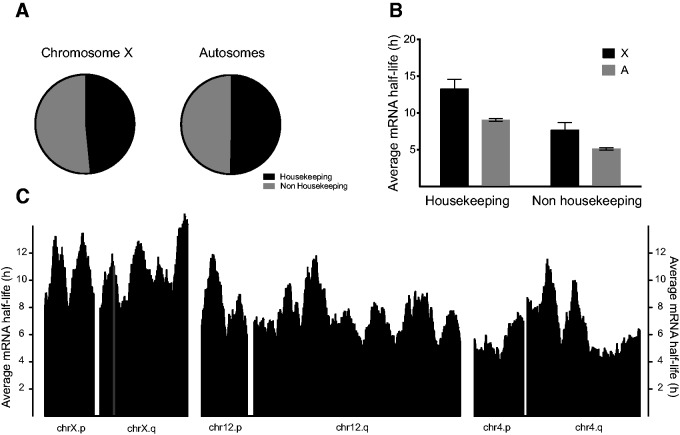
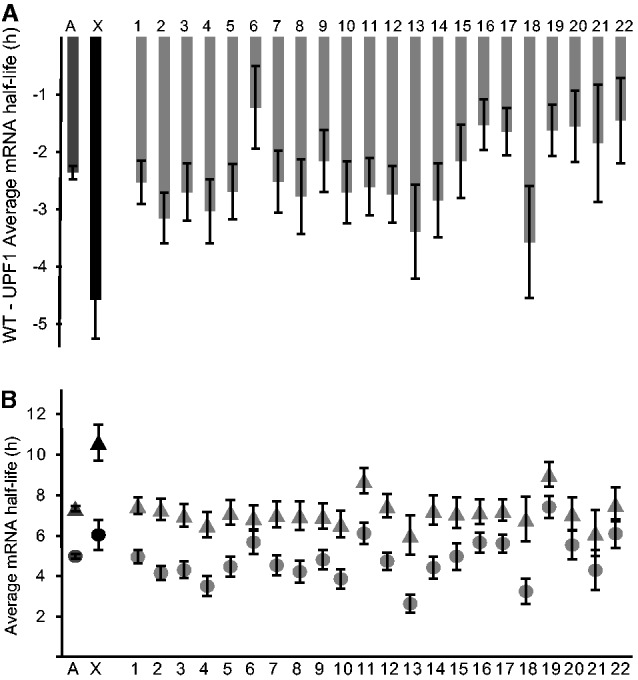
Mammalian sex chromosomes evolved from the degeneration of one homolog of a pair of ancestral autosomes, the proto-Y. This resulted in a gene dose imbalance that is believed to be restored (partially or fully) through upregulation of gene expression from the single active X-chromosome in both sexes by a dosage compensatory mechanism. We analyzed multiple genome-wide RNA stability data sets and found significantly longer average half-lives for X-chromosome transcripts than for autosomal transcripts in various human cell lines, both male and female, and in mice. Analysis of ribosome profiling data shows that ribosome density is higher on X-chromosome transcripts than on autosomal transcripts in both humans and mice, suggesting that the higher stability is causally linked to a higher translation rate. Our results and observations are in accordance with a dosage compensatory upregulation of expressed X-linked genes. We therefore propose that differential mRNA stability and translation rates of the autosomes and sex chromosomes contribute to an evolutionarily conserved dosage compensation mechanism in mammals.

Keywords: RNA half-life; RNA stability; dosage compensation; ribosome density; sex chromosomes.


Figures

F<sc>ig</sc>. 1.—
Fig. 1.—
Transcripts of X-chromosome genes have significantly longer half-lives than autosomal transcripts in HeLa cells. (A) Average half-life of transcripts of all genes on each chromosome (nX = 353, nA = 11,326). A, average half-life of transcripts of all autosomes. X, average half-life of transcripts of the X-chromosome. Error bars indicate 95% confidence intervals. (B) Descriptive statistics for the HeLa cells data set. (C) Histogram showing the frequency distribution of the averages from 106 samplings of 353 autosomal genes. The arrow indicates the value obtained for the X-chromosome.
F<sc>ig</sc>. 2.—
Fig. 2.—
Transcripts of X-chromosome genes have significantly longer half-lives (as measured by several methods) than autosomal transcripts in various cell types and both sexes. (row 1) Average half-life of transcripts of each chromosome. Error bars indicate 95% confidence intervals. (row 2) Correlation scatterplots of gene mRNA half-life (h). Each dot represents one gene. (row 3) Distribution of autosomal transcripts’ half-lives. (row 4) Distribution of X-chromosome transcripts’ half-lives. (A) B cells. (B) Gene-by-gene averages in four different male LCLs. (C) Gene-by-gene averages in three different female LCLs. (D) HeLa cells.
F<sc>ig</sc>. 3.—
Fig. 3.—
Transcripts of X-chromosome have similar levels and lengths to autosomal transcripts, but significantly different half-lives. (A) Average half-life of transcripts expressed by each chromosome versus average steady-state mRNA levels (RPKM). Note the high variability in steady-state mRNA levels in contrast to the significantly higher stability of X-chromosome transcripts. (B) Average half-life of transcripts expressed by each chromosome versus average chromosomal mRNA length (bp). Error bars indicate 95% confidence intervals.
F<sc>ig</sc>. 4.—
Fig. 4.—
Differential mRNA stability between X-chromosome and autosomal transcripts is conserved in mice. (A) Average half-life of transcripts of all genes on each chromosome in murine fibroblasts (nX = 151, nA = 4,722). A, average half-life of transcripts of all autosomes. X, average half-life of X-chromosome transcripts. Error bars indicate 95% confidence intervals. (B) Frequency distribution of autosomal transcript half-lives. (C) Frequency distribution of X-chromosome transcripts half-lives.
F<sc>ig</sc>. 5.—
Fig. 5.—
The ribosome density is significantly higher on X-chromosome transcripts and correlates with mRNA half-life but not mRNA levels, in humans and mice. (A) Average level of gene expression versus average ribosome density of transcripts of each chromosome in HeLa cells (12 h after mock transfection). (B) Average ribosome density versus average half-life (BRIC-seq) of transcripts of each chromosome in HeLa cells (12 h after mock transfection). (C) Average level of gene expression versus average ribosome density of transcripts of each chromosome in HeLa cells (32 h after mock transfection). (D) Average ribosome density versus average half-life (BRIC-seq) of transcripts of each chromosome in HeLa cells (32 h after mock transfection). (E) Average level of gene expression versus average ribosome density of transcript of each chromosome in mouse neutrophil cells. (F) Average ribosome density of transcripts of each chromosome in mouse neutrophil cells versus their average half-lives (BRIC-seq) in mouse fibroblast cells. A, average for all autosomes’ transcripts. X, averages for the X-chromosome’s transcripts. Error bars indicate 95% confidence intervals.
F<sc>ig</sc>. 6.—
Fig. 6.—
Intrinsic characteristics of mRNAs. (A) Average poly(A) tail length of transcripts of each chromosome. A, average poly(A) tail length of transcripts of all autosomes. X, average poly(A) tail length of transcripts of the X-chromosome. Error bars indicate 95% confidence intervals. (B) Gene scatterplot of poly(A) tail length versus half-life. Each dot represents one gene. (C) Chromosomal average of GC and GC3 contents of all CDS of the human genome (black and gray bars, respectively): 86,390 in total, including 2,585 situated on the X-chromosome. (D) Position of each chromosome along the first and second principal components obtained from a PCA of the 3′-UTR sequences of human genes.
F<sc>ig</sc>. 7.—
Fig. 7.—
The higher stability of X-chromosome transcripts is not related to the chromosome’s housekeeping gene content or spatial distribution. (A) Percentages of housekeeping (black) and nonhousekeeping genes (gray) located on the X-chromosome and autosomes in HeLa cells (nX = 353, nA = 11,326). (B) Average half-lives of transcripts of housekeeping and nonhousekeeping genes on the X-chromosome (black) and autosomes (gray) (nX = 353, nA = 11,326). Error bars indicate 95% confidence intervals. (C) Average half-lives of transcripts of spatial clusters of a sliding window of 30 genes. The bin where Xist is located is indicated in gray.
F<sc>ig</sc>. 8.—
Fig. 8.—
UPF1 knock-down has more effect on X-chromosome transcripts than autosomal transcripts. (A) Differences among chromosomes in average half-lives of transcripts after UPF1 depletion. (B) Average half-lives of transcripts of each chromosome, before (triangles) and after (circles) UPF1 depletion. A and X, averages for autosomal transcripts and X-chromosome transcripts, respectively.

References

    1. Birchler JA. Claims and counterclaims of X-chromosome compensation. Nat Struct Mol Biol. 2012;19:3–5. - PubMed
    1. Carlile TM, et al. Pseudouridine profiling reveals regulated mRNA pseudouridylation in yeast and human cells. Nature. 2014;515:143–146. - PMC - PubMed
    1. Castagne R, et al. The choice of the filtering method in microarrays affects the inference regarding dosage compensation of the active X-chromosome. PLoS One. 2011;6:e23956. - PMC - PubMed
    1. Chang H, Lim J, Ha M, Kim VN. TAIL-seq: genome-wide determination of poly(A) tail length and 3' end modifications. Mol Cell. 2014;53:1044–1052. - PubMed
    1. Conrad T, Akhtar A. Dosage compensation in Drosophila melanogaster: epigenetic fine-tuning of chromosome-wide transcription. Nat Rev Genet. 2011;13:123–134. - PubMed

Publication types

LinkOut - more resources