. 2015 Mar 19:5:9264.
doi: 10.1038/srep09264.

A combinatorial approach of comprehensive QTL-based comparative genome mapping and transcript profiling identified a seed weight-regulating candidate gene in chickpea

Affiliations

A combinatorial approach of comprehensive QTL-based comparative genome mapping and transcript profiling identified a seed weight-regulating candidate gene in chickpea

Deepak Bajaj et al. Sci Rep. .

Abstract

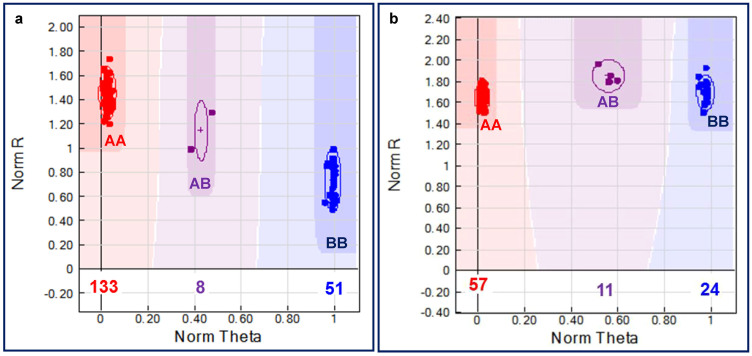
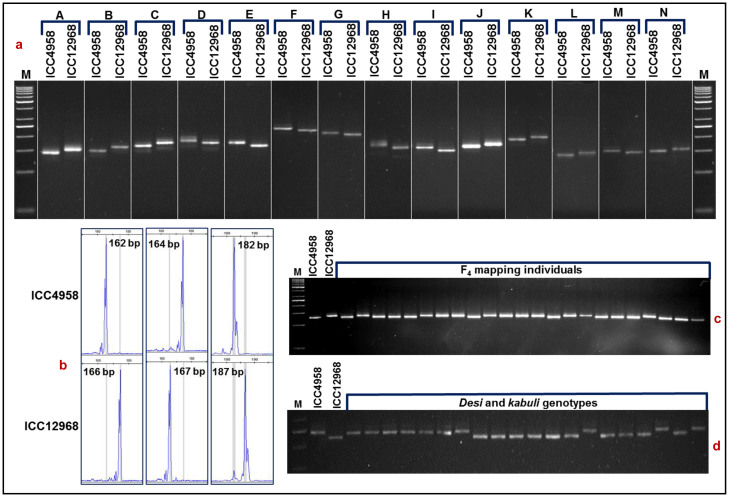
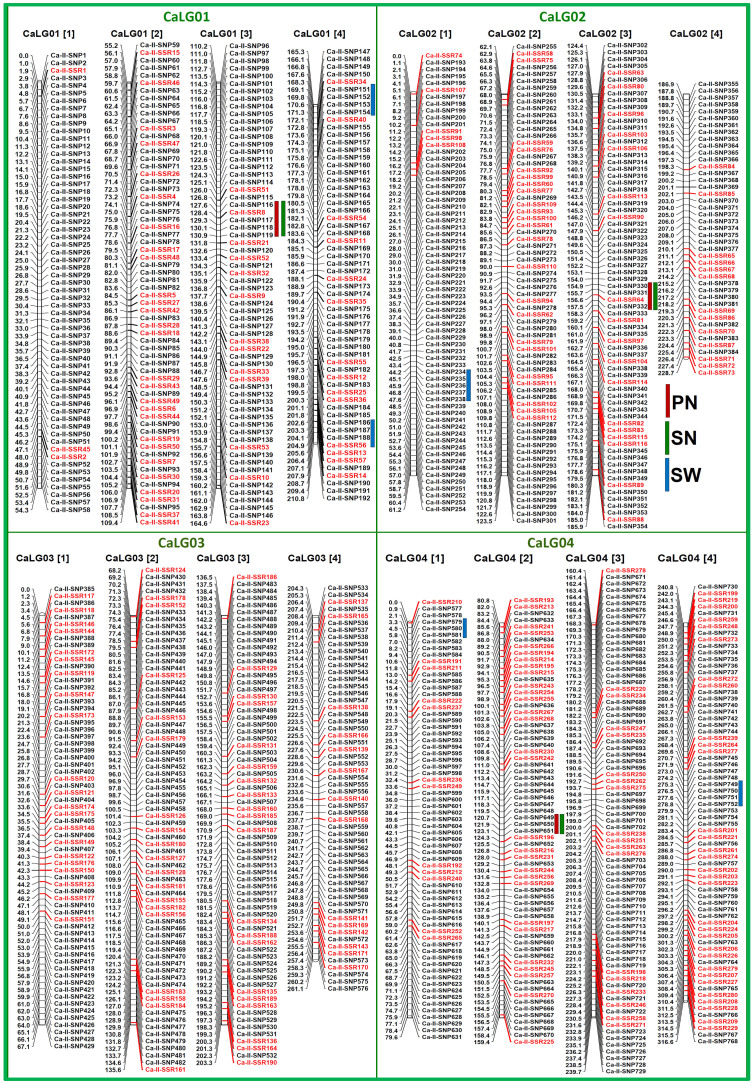
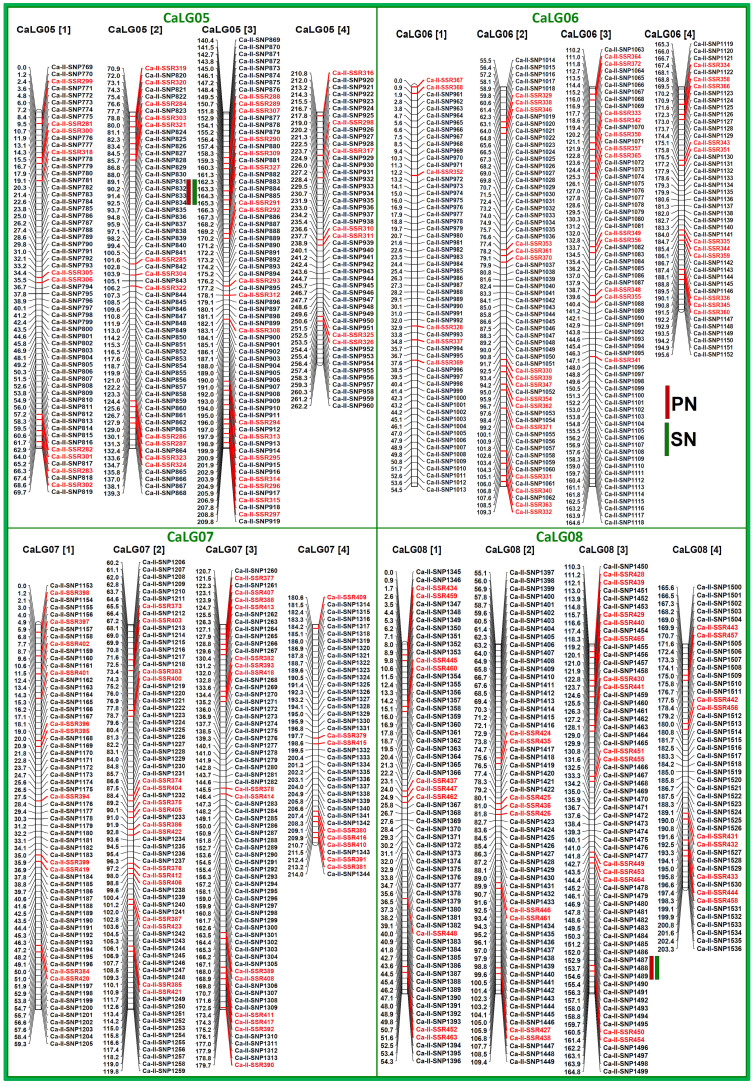
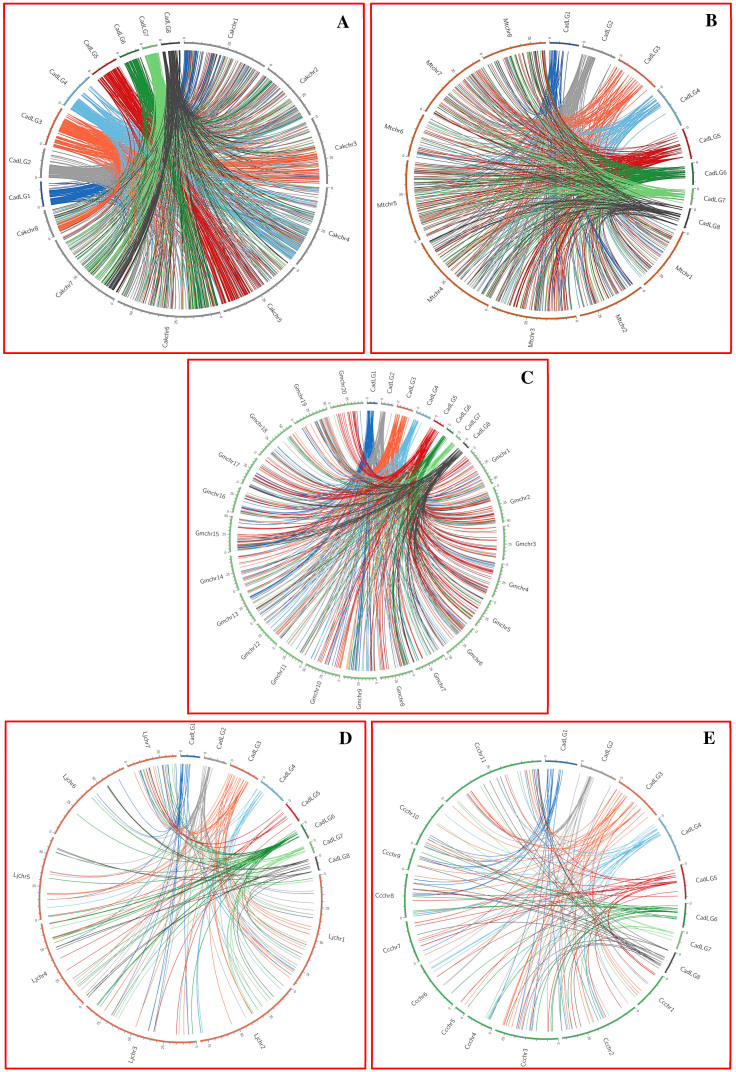
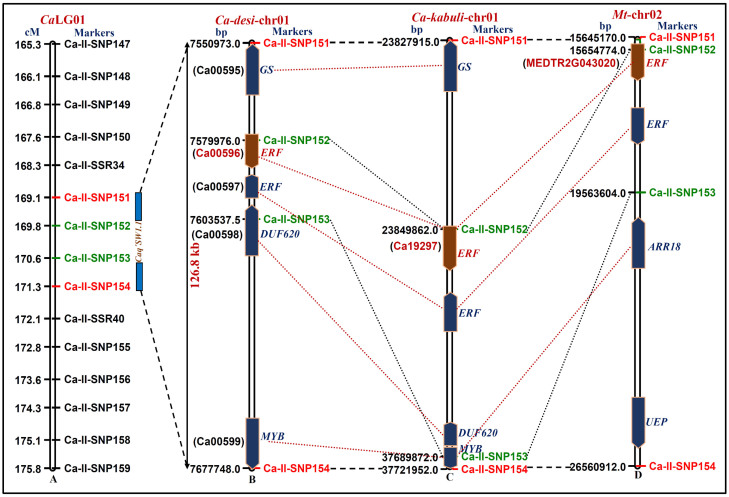
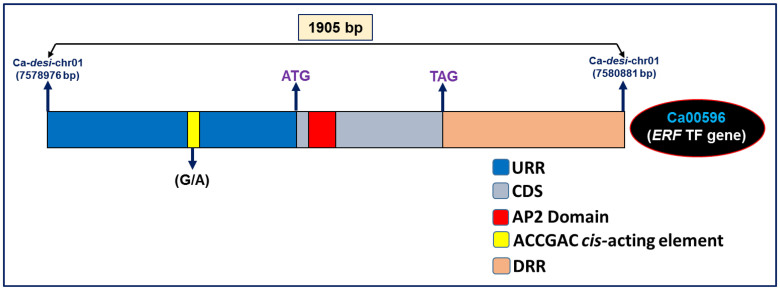
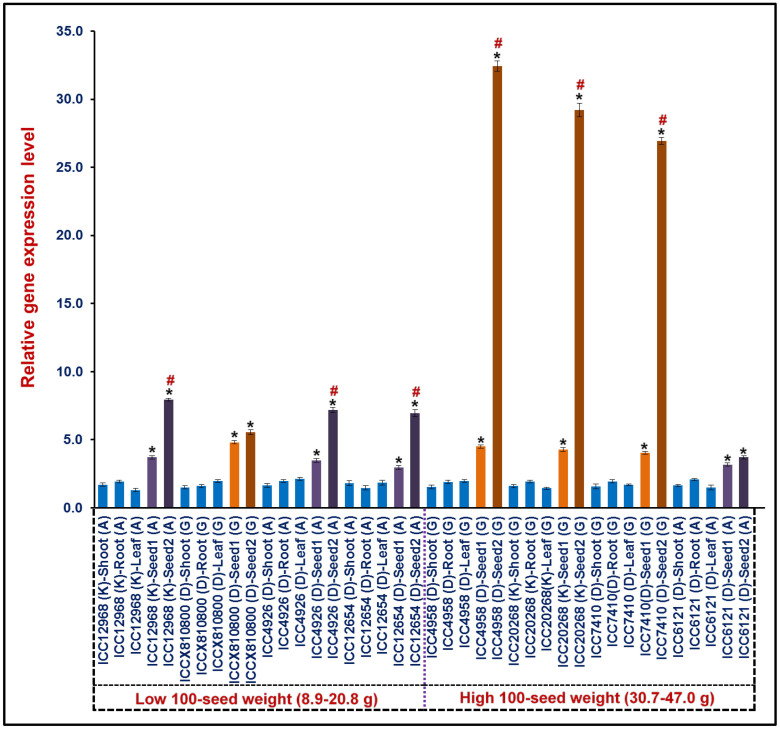
High experimental validation/genotyping success rate (94-96%) and intra-specific polymorphic potential (82-96%) of 1536 SNP and 472 SSR markers showing in silico polymorphism between desi ICC 4958 and kabuli ICC 12968 chickpea was obtained in a 190 mapping population (ICC 4958 × ICC 12968) and 92 diverse desi and kabuli genotypes. A high-density 2001 marker-based intra-specific genetic linkage map comprising of eight LGs constructed is comparatively much saturated (mean map-density: 0.94 cM) in contrast to existing intra-specific genetic maps in chickpea. Fifteen robust QTLs (PVE: 8.8-25.8% with LOD: 7.0-13.8) associated with pod and seed number/plant (PN and SN) and 100 seed weight (SW) were identified and mapped on 10 major genomic regions of eight LGs. One of 126.8 kb major genomic region harbouring a strong SW-associated robust QTL (Caq'SW1.1: 169.1-171.3 cM) has been delineated by integrating high-resolution QTL mapping with comprehensive marker-based comparative genome mapping and differential expression profiling. This identified one potential regulatory SNP (G/A) in the cis-acting element of candidate ERF (ethylene responsive factor) TF (transcription factor) gene governing seed weight in chickpea. The functionally relevant molecular tags identified have potential to be utilized for marker-assisted genetic improvement of chickpea.


Figures

Figure 1
Figure 1. Example of one regulatory SNP (G/A) validated in a ERF TF gene by Illumina GoldenGate genotyping assay showing homozygous and heterozygous cluster separation for 190 mapping individuals along with two parental genotypes (a) and 92 desi and kabuli genotypes (b) based on plotting of normalised R [sum of intensities of the two channels (Cy3 and Cy5)] on the y-axis vs. normalised theta [(2/π)Tan-1(Cy5/Cy3)] on the x-axis.
A normalised theta value nearest 0 is homozygous for allele A (red), a theta value nearest 0.5 is heterozygote AB (violet) and a theta value nearest 1 is homozygous for allele B (blue).
Figure 2
Figure 2. Validation of a representative set of 14 SSR markers (physically mapped on eight chickpea chromosomes) showing in silico fragment length polymorphism between parental genotypes (ICC 4958 and ICC 12968) of a F4 mapping population (ICC 4958 × ICC 12968) using the gel-based assay (a) and fluorescent-dye labeled automated fragment analyzer (b). (c) Segregation pattern of one selected SSR marker in a representative set of mapping individuals. (d) Amplification and polymorphism profiles of one SSR marker in a selected set of desi and kabuli genotypes.
The fragment sizes (bp) of the amplified polymorphic alleles are indicated. The identities of SSR markers with their detailed information are provided in the Supplementary Table S1. M: 50 bp DNA ladder size standard.
Figure 3
Figure 3. Eight major genomic regions underlying 11 robust QTLs (PVE: 8.5–25.8%, LOD: 6.5–13.8) associated with three agronomic quantitative traits (PN, SN and SW) identified and mapped on four LGs (CaLG01-CaLG04) using a 190 F4 mapping population (ICC 4958 × ICC 12968) of chickpea.
The genetic distance (cM) and identity of the marker loci integrated on the chromosomes are indicated on the left and right side of the LGs, respectively. Red, green and blue boxes indicate the QTLs regulating PN, SN and SW mapped on eight LGs, respectively. For clear visibility, the individual LG has been divided into four parts; [1], [2], [3] and [4] based on lower to higher genetic positions of mapped markers.
Figure 4
Figure 4. Two major genomic regions underlying four robust QTLs (PVE: 8.8–14.7%, LOD: 7.3–9.6) associated with two agronomic quantitative traits (PN and SN) identified and mapped on four LGs (CaLG05-CaLG08) using a 190 F4 mapping population (ICC 4958 × ICC 12968) of chickpea.
The genetic distance (cM) and identity of the marker loci integrated on the chromosomes are indicated on the left and right side of the LGs, respectively. Red and green boxes indicate the QTLs regulating PN and SN mapped on eight LGs, respectively. For clear visibility, the individual LG has been divided into four parts; [1], [2], [3] and [4] based on lower to higher genetic positions of mapped markers.
Figure 5
Figure 5. Comparative genome mapping of 2001 SNP and SSR markers genetically/physically mapped on eight desi chickpea LGs/chromosomes with their physical position on the pseudomolecules of kabuli chickpea (A), M. truncatula (B), G. max (C), L. japoincus (D) and C. cajan (E) chromosomes depicted conserved syntenic relationships among five legume genomes, which are depicted in the Circos circular ideogram. A high-degree of conserved collinear synteny among the chromosomes of desi and kabuli chickpea and Medicago genomes was evident.
The outermost circles represent the LGs/chromosomes of five legume genomes coded with different colours. The syntenic relationships of each LGs/chromosomes between two legume species are marked individually with different coloured lines.
Figure 6
Figure 6. Integration of genetic (A) and physical (B) map identified and mapped one robust SW-governing major Caq'SW1.1 QTL on 126.8 kb genomic region of desi chickpea chromosome 1. The marker-based comparative genome mapping revealed a high-degree of conserved collinear syntenic relationships of five candidate protein-coding desi genes annotated at this target genomic sequence interval with kabuli chickpea chromosome 1 (C) and Medicago chromosome 2 (D). A regulatory SNP (G/A) (Ca-II-SNP152) in a ERF TF gene showing strong linkage with Caq'SW1.1 QTL and conserved synteny with ERF orthologous genes annotated from kabuli chromosome 1 (C) and Medicago chromosome 2 (D), was selected as potential candidate for seed weight regulation in chickpea.
The genetic (cM)/physical (bp) distance and identity of the markers mapped on the chromosomes are indicated on the left and right side of the chromosomes, respectively. Red and blue dotted lines represent the gene- and marker-based syntenic relationships, respectively among desi and kabuli chickpea and Medicago chromosomes.
Figure 7
Figure 7. Structural annotation of one candidate SW-associated AP2-domain-containing ERF TF gene delineated at a major Caq'SW1.1 QTL interval by integrating QTL mapping with comparative genome mapping and differential expression profiling.
Diverse coding (functional domain) and non-coding upstream (URR) and downstream (DRR) regulatory regions of gene are highlighted. One functionally relevant SNP (G/A) identified in the DRE cis-acting element (ACCGAC) of ERF gene possibly involved in transcriptional regulation of this gene for seed weight and development in chickpea is indicated. CDS: coding sequences.
Figure 8
Figure 8. Differential expression profiling of a strong SW-associated regulatory SNP-containing ERF TF gene in three different vegetative (shoot, root and leaf) and two seed developmental stages (S1 and S2: Seed development stages 1 and 2 occurring at 10–20 and 21–30 days after podding, respectively) of eight low (ICC 12968, ICCX-810800, ICC 4926 and ICC 12654 with 100 seed weight: 8.9–20.8 g) and high (ICC 4958, ICC 20268, ICC 7410 and ICC 6121 with 30.7–47.0 g) seed weight contrasting chickpea genotypes as well as parents of mapping population using quantitative RT-PCR assay.
The elongation factor-1 alpha gene was used as an internal control in the RT-PCR assay to normalize the expression values across different tissues/developmental stages of chickpea genotypes and mapping parents. The bars indicate mean (± standard error) of three independent biological replicates with two technical replicates for each sample used in RT-PCR. *Significant differences in gene expression at seed developmental stages of genotypes as compared to leaf at p ≤ 0.01 (LSD-ANOVA significance test). #Significant differences in gene expression between S1 and S2 seed developmental stages of genotypes at p ≤ 0.001 (LSD-ANOVA significance test). The ‘G' and ‘A' SNP-alleles identified in the cis-acting element of ERF TF gene possibly regulating seed weight in desi (D) and kabuli (K) chickpea genotypes are represented.

References

    1. Winter P. et al. Characterization and mapping of sequence-tagged microsatellite sites in the chickpea (Cicer arietinum L.) genome. Mol. Gen. Genet. 262, 90–101 (1999). - PubMed
    1. Winter P. et al. A linkage map of chickpea (Cicer arietinum L.) genome based on recombinant inbred lines from a C. arietinum x C. reticulatum cross: localization of resistance genes for Fusarium wilt races 4 and 5. Theor. Appl. Genet. 101, 1155–1163 (2000).
    1. Abbo S. et al. Quantitative trait loci governing carotenoid concentration and weight in seed of chickpea (Cicer arietinum L.). Theor. Appl. Genet. 111, 185–195 (2005). - PubMed
    1. Millan T. et al. A consensus genetic map of chickpea (Cicer arietinum L.) based on 10 mapping populations. Euphytica 175, 175–189 (2010).
    1. Nayak S. N. et al. Integration of novel SSR and gene-based SNP marker loci in the chickpea genetic map and establishment of new anchor points with Medicago truncatula genome. Theor. Appl. Genet. 120, 1415–1441 (2010). - PMC - PubMed

Publication types

LinkOut - more resources