. 2015 Aug;259(2):129-136.
doi: 10.1111/jmi.12231. Epub 2015 Mar 18.

Correlation of two-photon in vivo imaging and FIB/SEM microscopy

Affiliations

Correlation of two-photon in vivo imaging and FIB/SEM microscopy

L Blazquez-Llorca et al. J Microsc. 2015 Aug.

Abstract

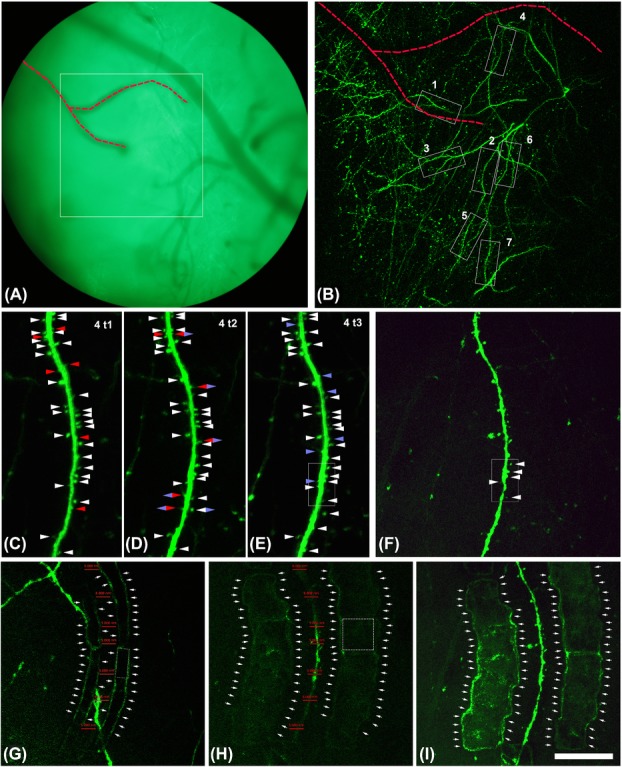
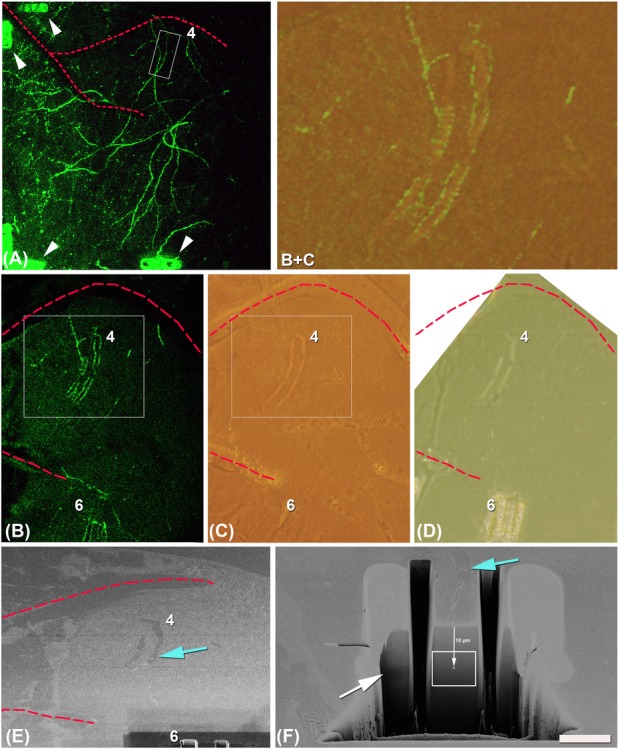
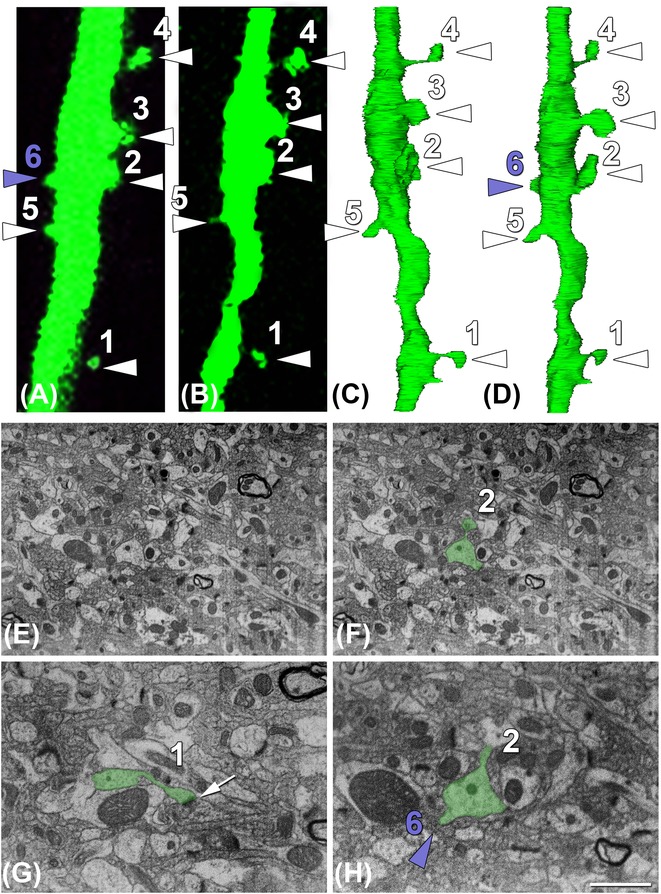
Advances in the understanding of brain functions are closely linked to the technical developments in microscopy. In this study, we describe a correlative microscopy technique that offers a possibility of combining two-photon in vivo imaging with focus ion beam/scanning electron microscope (FIB/SEM) techniques. Long-term two-photon in vivo imaging allows the visualization of functional interactions within the brain of a living organism over the time, and therefore, is emerging as a new tool for studying the dynamics of neurodegenerative diseases, such as Alzheimer's disease. However, light microscopy has important limitations in revealing alterations occurring at the synaptic level and when this is required, electron microscopy is mandatory. FIB/SEM microscopy is a novel tool for three-dimensional high-resolution reconstructions, since it acquires automated serial images at ultrastructural level. Using FIB/SEM imaging, we observed, at 10 nm isotropic resolution, the same dendrites that were imaged in vivo over 9 days. Thus, we analyzed their ultrastructure and monitored the dynamics of the neuropil around them. We found that stable spines (present during the 9 days of imaging) formed typical asymmetric contacts with axons, whereas transient spines (present only during one day of imaging) did not form a synaptic contact. Our data suggest that the morphological classification that was assigned to a dendritic spine according to the in vivo images did not fit with its ultrastructural morphology. The correlative technique described herein is likely to open opportunities for unravelling the earlier unrecognized complexity of the nervous system.

Keywords: Dendritic spine; electron microscopy; green fluorescent protein; three-dimensional reconstruction.


Figures

Figure 1
Figure 1
2P in vivo imaging of layer I dendrites of pyramidal neurons over time. (A) Blood vessel distribution was used in addition to coordinate setting to accurately relocate the same position for 2P imaging over time. Square in (A) surrounds the area that was imaged in (B). (B) Overview of the selected dendrites taken in vivo for the correlative approach. Stack of 100 images with a z-step of 3 μm. Note that the dashed red line indicates the same blood vessels in (A) and (B) that are useful to relocalize the dendrite 4. The same blood vessels are indicated in Figure2. C–E: Dendrite 4 imaged in vivo at different time points (1 week between t1 and t2; 1 day between t1 and t2). Stack of 20 images with a z-step of 1 μm. Note that white arrow heads point out spines that were present during the whole imaging period. Red arrow heads point out spines that will disappear in the next time point. Blue arrow heads point out spines that appear in this time point. Blue and red rhombus point out spines that appear in this time point but they are no longer present in the next time point. Blue and white rhombus points out spines that appear in this time point and that are present until the last imaging time point. (F) Dendrite 4 imaged ex vivo in the thick section before the laser marking. Note that the white rectangle present in (E) and (F) surround the dendritic segment that was further imaged and reconstructed with the FIB/SEM (see Fig.3). Stack of 20 images with a z-step of 1 μm. (G–H) Single plane of dendrite 4 relocated ex vivo in the thick section after the laser marking, 10 μm over the dendrite (G) and in the same focal plane of the dendrite (H). Marks are necessary to recongnize the region that has to be scanned with the FIB/SEM. Marks (single crop frame around 10 × 10 μm, dashed line cube in H) were made around the dendrite of interest in the central focal plane of the dendrite (around 5–10 μm far from the dendrite (H). Ten micrometers over this central plane other smaller marks (single crop frame around 10 × 5 μm, dashed line rectangle in G) were made resembling the profile of the dendrite (G). Note that red lines in G and H are located in the same position in both images and their size is 5 μm. Thus, it is observed how the marks made 10 μm over (G) resemble perfectly the shape of the dendrite located below (H). (I) Maximum intensity projection of dendrite 4. Stack of 20 images with a z-step of 1 μm. Laser marks are clearly visible. In (G–I), arrows point out the outer limit of the NIRB marks. Scale bar (in I): 134 μm in A, 89 μm in B, 19 μm in C–F, 26 μm in G–I.
Figure 2
Figure 2
Laser marks are used for finding the dendrites of interest at the EM level. (A) Same overview of the selected dendrites for the correlative approach as in Figure1(B), taken ex vivo after the perfusion of the animal. Note that marks were made in some corners and borders of the overview (arrow heads) to facilitate the finding of the positions in the thick slice cut from the window region. (B) Single plane taken in the thin vibratome section (50 μm) showing two laser marks (around dendrites 4 and 6, the marks around dendrite 6 are only partially seen). The marks around dendrite 4 are the smaller ones performed 10 μm over the focal plane of the dendrite (as shown in Fig. 1G). (C) The same area as in (B) imaged postembedding. Laser marks could be easily identified. In this image, marks of dendrite 6 are not so clearly visible because the ones in focus belong to dendrite 4. (B and C) Area delimited in the rectangles in B and C and obtained after superposition of both images and decreasing the opacity of image B to 30%. Note that at the fluorescence level the most prominent part of the marks is the autofluorescence of the borders, however, at the light microcopy level after osmication the marks are visible as holes in the tissue and the borders are no longer so evident. (D) Last semi-thin section taken from the surface of the block once the smaller laser marks 10 μm over the focal plane of the dendrite 4 were reached. Note that around the marks of dendrite 6, a trench was previously opened with the FIB/SEM (as also seen in panel E). (E) Position recovery on the crossbeam. Laser marks are visible on the SEM image on the surface of the block. (F) Trench opened in front of the beginning of the mark and along the mark shown in (E) to free the region to image and avoid shadows. Note that serial FIB/SEM images were taken in the position and of the size indicated by the white rectangle. The centre of the images was established at 10 μm from the surface of the block and at the same z level of the bigger marks made at the focal plane of the dendrite 4 (with arrow; see Fig.1H). Blue arrow is pointing out exactly the same position of the superficial smaller mark (see Fig. 1G) in (E) and (F). Note that as in Figures1(A, B) the dashed red lines (in B–D) indicate the same blood vessels. Scale bar (in E): 91.4 μm in A, 50.8 μm in B–D, 18 μm in B + C, 43 μm in E, 7 μm in F.
Figure 3
Figure 3
Correlative imaging of a segment of dendrite 4 using 2P and FIB Crossbeam imaging. (A, B) In vivo (last time point) and ex vivo imaging, respectively, of the segment of dendrite 4 that was further image with the FIB/SEM. (C, D) Three-dimensional reconstructions of the area of interest. Dendritic spines can be clearly localized. Note that the reconstruction in (C) resembles better the segment of the dendrite that was imaged ex vivo (B). (D) The same reconstruction as in (C) but slightly rotated so the dendritic spine number 6 that was present in the in vivo imaging (A) is also visible. (E, F) Example of one of the FIB/SEM images that were taken in the stack of 1300 serial sections before (E) and after (F) segmentation of the dendrite of interest (green). (G, H) Detail of two of the FIB/SEM images showing a synaptic (G; white arrow points out the synaptic contact) and a nonsynaptic dendritic spine (H; spine number 6). Note that the spines pointed out with a white arrow head (1–5) were present during the whole imaging period and thus, they correspond to ‘stable’ spines. All the stable spines established synapses with excitatory axons (see G in example). The transient spine number 6 (purple arrow head) that was only present in the last imaging time point did not establish synapses with any axon, thus it is a nonsynaptic dendritic spine (see H in example). Note that in some cases those dendritic spines defined as stubby at the fluorescent level (e.g. dendritic spine 2 in A, B) presented a differentiated and clear neck at the ultrastructural level (e.g. dendritic spine 2 in E, F). Scale bar (in H): 2 μm in (A–D), 2.7 μm in (E–F), 1.4 μm in (G, H).

References

    1. Bishop D, Nikic I, Brinkoetter M, Knecht S, Potz S, Kerschensteiner M. Misgeld T. Near-infrared branding efficiently correlates light and electron microscopy. Nat. Methods. 2011;8:568–570. - PubMed
    1. Bittner T, Burgold S, Dorostkar MM, Fuhrmann M, Wegenast-Braun BM, Schmidt B, Kretzschmar H. Herms J. Amyloid plaque formation precedes dendritic spine loss. Acta Neuropathol. 2012;124:797–807. - PMC - PubMed
    1. Bittner T, Fuhrmann M, Burgold S, et al. Multiple events lead to dendritic spine loss in triple transgenic Alzheimer’s disease mice. PloS One. 2010;5:e15477. - PMC - PubMed
    1. Blazquez-Llorca L, Merchan-Perez A, Rodriguez JR, Gascon J. DeFelipe J. FIB/SEM technology and Alzheimer’s disease: three-dimensional analysis of human cortical synapses. J. Alzheimers Dis. 2013;34:995–1013. - PubMed
    1. Burgold S, Bittner T, Dorostkar MM, et al. In vivo multiphoton imaging reveals gradual growth of newborn amyloid plaques over weeks. Acta Neuropathol. 2011;121:327–335. - PMC - PubMed

Publication types

LinkOut - more resources