. 2015 Apr 15;194(8):3567-82.
doi: 10.4049/jimmunol.1401220. Epub 2015 Mar 18.

The TNF-family ligand TL1A and its receptor DR3 promote T cell-mediated allergic immunopathology by enhancing differentiation and pathogenicity of IL-9-producing T cells

Affiliations

The TNF-family ligand TL1A and its receptor DR3 promote T cell-mediated allergic immunopathology by enhancing differentiation and pathogenicity of IL-9-producing T cells

Arianne C Richard et al. J Immunol. .

Erratum in

Abstract

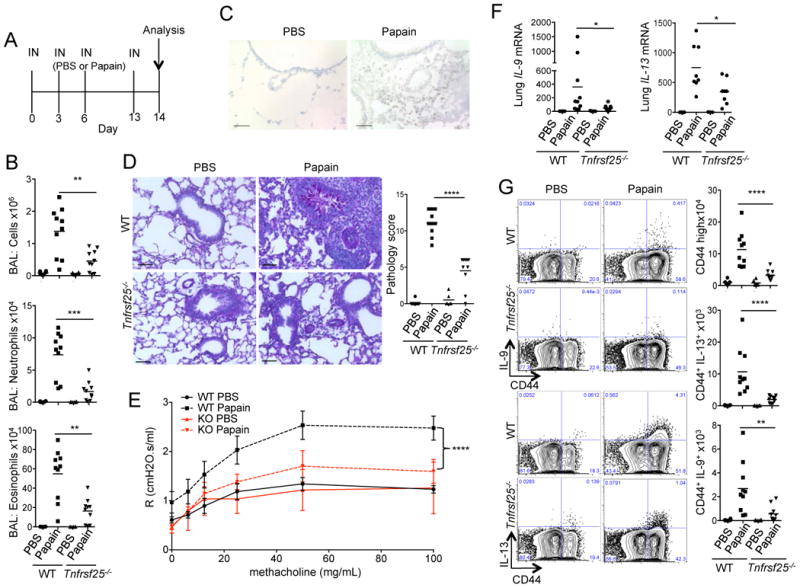
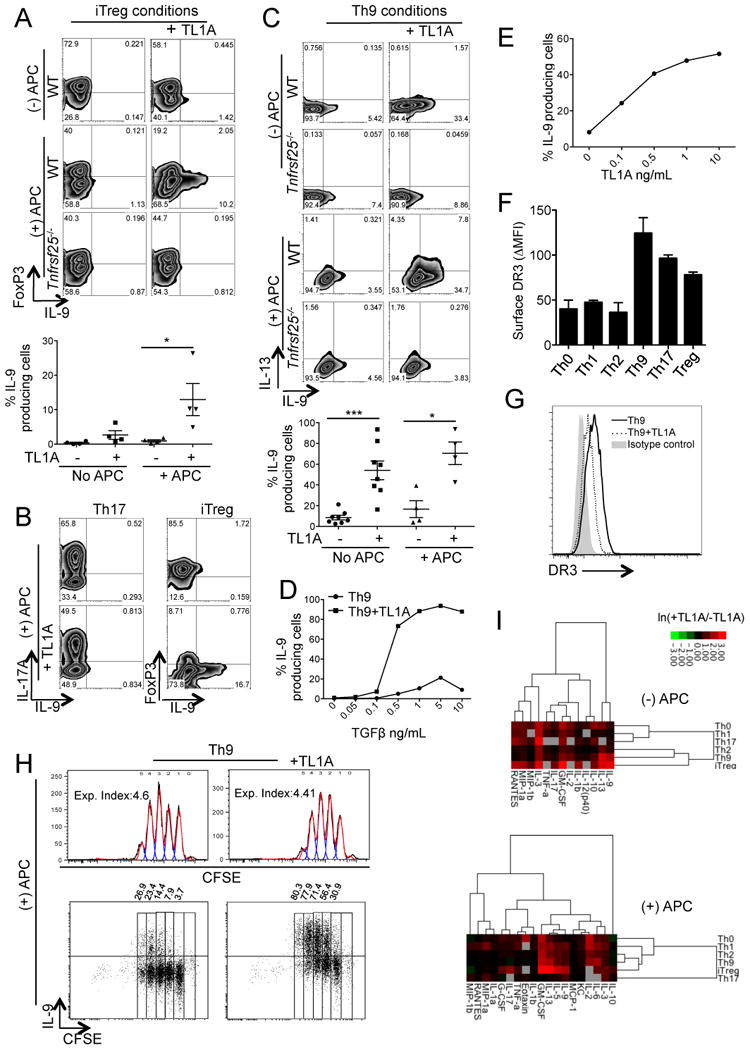
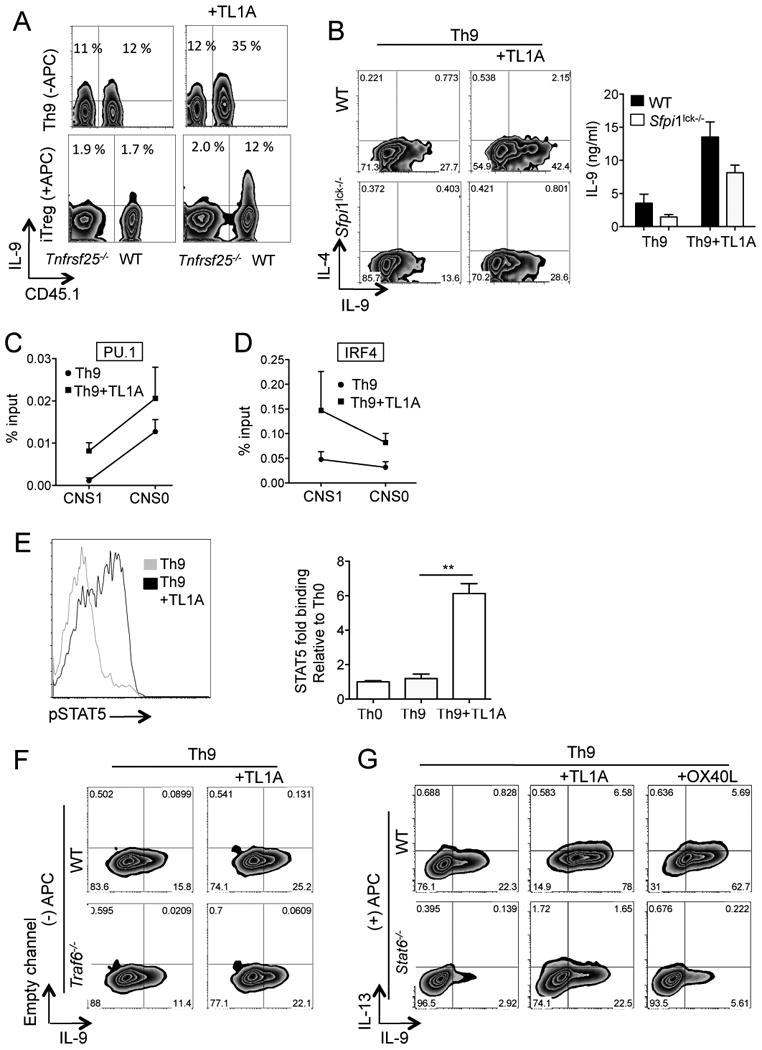
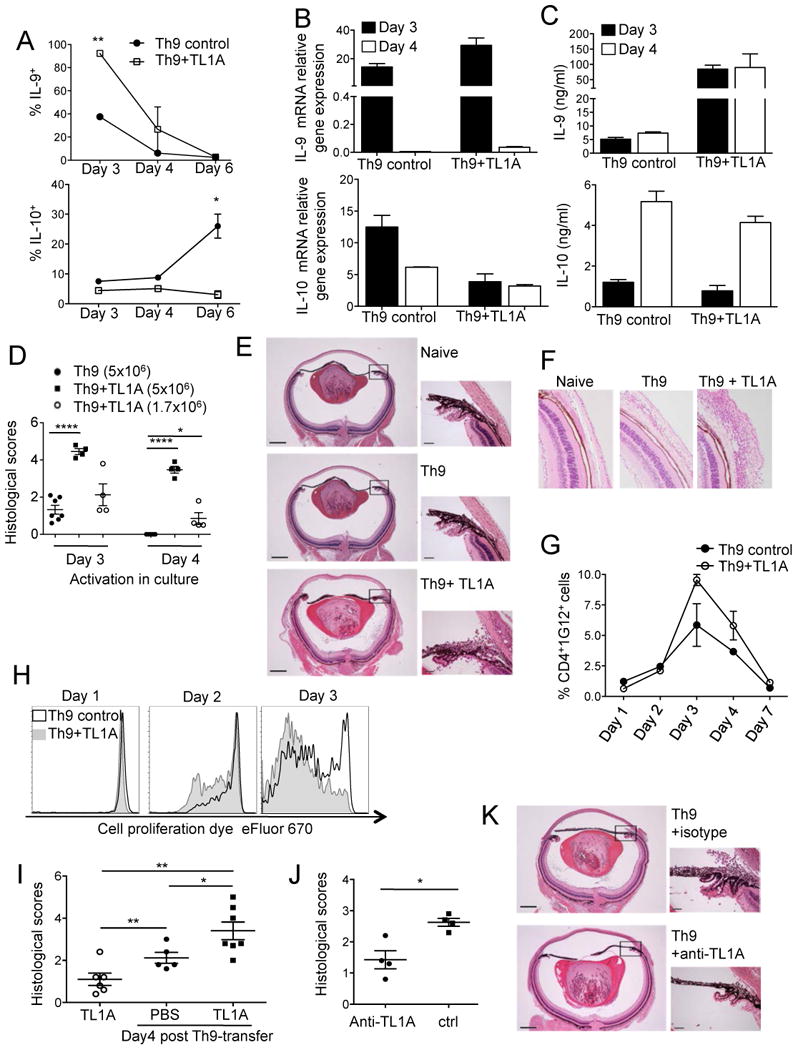
The TNF family cytokine TL1A (Tnfsf15) costimulates T cells and type 2 innate lymphocytes (ILC2) through its receptor DR3 (Tnfrsf25). DR3-deficient mice have reduced T cell accumulation at the site of inflammation and reduced ILC2-dependent immune responses in a number of models of autoimmune and allergic diseases. In allergic lung disease models, immunopathology and local Th2 and ILC2 accumulation is reduced in DR3-deficient mice despite normal systemic priming of Th2 responses and generation of T cells secreting IL-13 and IL-4, prompting the question of whether TL1A promotes the development of other T cell subsets that secrete cytokines to drive allergic disease. In this study, we find that TL1A potently promotes generation of murine T cells producing IL-9 (Th9) by signaling through DR3 in a cell-intrinsic manner. TL1A enhances Th9 differentiation through an IL-2 and STAT5-dependent mechanism, unlike the TNF-family member OX40, which promotes Th9 through IL-4 and STAT6. Th9 differentiated in the presence of TL1A are more pathogenic, and endogenous TL1A signaling through DR3 on T cells is required for maximal pathology and IL-9 production in allergic lung inflammation. Taken together, these data identify TL1A-DR3 interactions as a novel pathway that promotes Th9 differentiation and pathogenicity. TL1A may be a potential therapeutic target in diseases dependent on IL-9.


Figures

Figure 1
Figure 1. DR3 is required for optimal pathology and IL-9 and IL-13 production in T-cell driven allergic lung inflammation
(A)Time line of antigen sensitization and challenge in this model; IP (intraperitoneal), IN (intranasal), and IT (intratracheal). (B) mRNA levels of IL-9 and IL-13 measured by qRT-PCR are shown for lung samples harvested 16 or 18 days after initial challenge with ovalbumin. Values were normalized to the average level of RNA in the PBS-treated wild-type (WT) mice at each time point (t-test statistics comparing Ova-treated WT and Ova-treated Tnfrsf25-/- mice, *p<0.05, **p<0.01). (C) Frequency of IL-9 and IL-13 producing CD4+CD44hi T cells in the lung are shown from cells harvested at day 16 from mice challenged as in (A). Right panels, absolute numbers with total number of CD4+CD44hi cells shown at the top. (D) PAS-stained sections of lungs harvested at day 16 from mice challenged as in (A); airways (aw), and blood vessels (bv) marked; scale bar = 50 μm. Bottom panel shows histopathology scores. (E) Airway resistance was measured in response to increasing doses of aerosolized methacholine in mice challenged as in (A). Results are a combination of 2 independent experiments (Two-way ANOVA comparing Ova-treated WT and Tnfrsf25-/- mice, **genotype term p<0.01). (F) Absolute numbers of eosinophils and neutrophils in the bronchoalveolar lavage (BAL) of mice treated as in (A) at day 16 are shown (Mann-Whitney test: *p<0.05, **p<0.01). (A-D and F) are representative of at least 2 independent experiments.
Figure 2
Figure 2. DR3 is required for optimal pathology and IL-9 and IL-13 production by T cells in response to an inhaled allergen
(A) WT or Tnfrsf25-/- mice were given intranasal PBS or papain according to the timeline. All mice were euthanized 12 hours after the last challenge. (B) Total cell counts, neutrophils and eosinophils present in the BAL. (C) Localization of TL1A expression in the lungs of WT mice treated with PBS or papain is demonstrated by immunohistochemistry. (D) Lung histology of WT and Tnfrsf25-/- mice (PAS staining, left panel). Scale bar= 50 μm. Histopathology scores of lung sections from the indicated groups of mice (right panel). (E) Airway resistance was measured in response to increasing doses of aerosolized methacholine in mice challenged as in (A) (Two-way ANOVA comparing papain-treated WT and Tnfrsf25-/- mice, ****genotype term p<0.0001). (F) IL-9 and IL-13 mRNA expression in the lung relative to β2m in each condition. Values were normalized to the average level of RNA in PBS-treated WT mice. (G) Frequency and total number of IL-9- or IL-13-producting CD45+TCRβ+CD4+CD44+ T cells, as well as total CD44high T cells, were measured by flow cytometry. In all panels, averages are indicated for each group and statistical significances between papain-treated WT and Tnfrsf25-/- mice are shown (Mann-Whitney, *p< 0.05, **p<0.01, ***p< 0.001, **** p<0.0001). (A-G) are pooled data from 2 experiments.
Figure 3
Figure 3. TL1A enhances IL-9 production by T cells differentiated under Th9 and iTreg conditions
(A) Naïve CD4+ T cells from WT and Tnfrsf25-/- mice were differentiated for 3 days under iTreg conditions with or without TL1A, in the absence or presence of T-depleted antigen presenting cells (APC). Intracellular staining shows a representative experiment, with a compilation of 4 independent experiments depicted below (Mann-Whitney test, *p<0.05). (B) Naïve CD4+ T cells from WT mice were differentiated into Th17 or iTreg with and without TL1A in the presence of APC. Intracellular staining is representative of 2 independent experiments. (C) Naïve CD4+ T cells isolated from WT and Tnfrsf25-/- mice were differentiated into Th9 in the absence or presence of APC with or without TL1A. Representative intracellular staining is shown with a compilation of 8 independent experiments (-APC) and 4 independent experiments (+APC) (Mann-Whitney test, *p<0.05, ***p<0.001). (D) Th9 differentiation was performed as in (C) in the absence of APC, with varying concentrations of TGFβ. Percentage of IL-9-producing cells by intracellular staining is representative of 2 independent experiments. (E) Th9 differentiation was performed as in (C) without APC, with varying amounts of TL1A. Percentage of IL-9-producing cells by intracellular staining is representative of 2 independent experiments. (F) DR3 surface expression vs. isotype control was measured by flow cytometry in naïve CD4+ T cell cultures differentiated in the absence of APC under various polarization conditions. Results are a compilation of 2 independent experiments; error bars represent +/- SEM. (G) DR3 surface expression was measured by flow cytometry in Th9 cultures with and without TL1A. Results are representative of 2 independent experiments. (H) Naïve WT CD4+ T cells were CFSE-labeled and differentiated under Th9 conditions as in (C) in the presence of APC: top row, CFSE dilution with the indicated expansion index; bottom row, CFSE dilution versus intracellular IL-9 with the percentage of cells producing IL-9 after each division shown above each box. Results are representative of 2 independent experiments. (I) Cytokines were measured in the supernatants from Th9 differentiation cultures without (top) or with T-depleted splenocytes (bottom). Heatmaps show TL1A-induced cytokine changes within each condition (red, increased; green, decreased; black, no change; grey, undetectable in one or both conditions). Results show average changes from two independent experiments. Only those cytokines detectable with and without TL1A in at least 4 polarization conditions are shown.
Figure 4
Figure 4. TL1A-induced Th9 differentiation depends on IL-2 and STAT5
(A) Naïve CD4+ T cells were polarized under Th9 conditions with or without TL1A, with the indicated blocking antibodies or added cytokines; left and middle panels without APC, right panel with APC. IL-9 production assayed by flow cytometry is representative of 2 independent experiments. (B) WT and STAT6-deficient (Stat6-/-) naïve CD4+ T cells were differentiated in the presence of APC under Th9 and iTreg conditions with and without TL1A. Intracellular staining is representative of 3 independent experiments. (C) Control Stat5fl/fl and STAT5-deficient (Stat5CD4-/-) naïve CD4+ T cells were differentiated in the presence of APC under Th9 conditions with and without TL1A. Intracellular staining is representative of 2 independent experiments. (D) WT naïve CD4+ T cells were transfected with a constitutively active caSTAT5-retrovirus or control virus and differentiated under Th0, Th17 in the presence of IL-2, and regular Th17 (blocking IL-2) conditions. Intracellular staining is representative of 2 independent experiments.
Figure 5
Figure 5. Cell-intrinsic effects of TL1A in Th9 differentiation are independent of PU.1 and Traf6
(A) Naïve CD4+ T cells from CD45.1+ congenic WT mice were mixed with an equal number of naïve CD4+ T cells from CD45.1- Tnfrsf25-/- mice and polarized under Th9 conditions without APC, or under iTreg conditions with APC, with and without TL1A. IL-9 intracellular staining versus CD45.1 surface staining with the percentages of CD45.1+ and CD45.1- cells expressing IL-9 is representative of 2 independent experiments. (B) WT and PU.1-deficient (Sfpi1lck-/-) naïve CD4+ T cells were differentiated without APC under Th9 conditions with and without TL1A. Left panel shows intracellular staining. Right panel shows IL-9 production in the supernatant of restimulated cells 5 days after polarization by ELISA. Results are representative of 2 independent experiments. (C) Naïve CD4+ T cells were differentiated without APC under Th9 conditions for 5 days and analyzed by ChIP assay for PU.1 binding to the IL-9 promoter. Error bars represent combined results from 3 mice, representative of 2 independent experiments. (D) As (C), cells were analyzed by ChIP assay for IRF4 binding to the IL-9 promoter. Error bars represent combined results from 4 mice in two independent experiments. (E) WT naïve CD4+ T cells were differentiated without APC under Th9 conditions for 3 days and stained for intracellular phospho-STAT5 (left panel), representative of 2 independent experiments. Cells were also analyzed by ChIP assay for STAT5 binding to the IL-9 promoter (right panels). Error bars represent SEM of technical qPCR replicates. Data is representative of 2 independent experiments. (F) WT and Traf6-/- naïve CD4+ T cells were polarized under Th9 conditions in the absence of APC, with or without TL1A. Intracellular staining is representative of 2 independent experiments. (G) WT and Stat6-/- naïve CD4+ T cells were polarized in the presence of APC under Th9 conditions with or without TL1A or OX40L. Intracellular staining is representative of 3 independent experiments.
Figure 6
Figure 6. TL1A enhances ocular inflammation induced by Th9
(A) Naïve anti-HEL CD4+ TCR transgenic T cells were activated with HEL+APC under Th9 conditions, with or without TL1A. Cells were analyzed for intracellular IL-9 and IL-10 production at the indicated time points (Student's T test: * p<0.05, **p<0.01); combined results from 3 independent experiments. (B) IL-9 and IL-10 mRNA was measured relative to β-actin in cultures described in (A); combined results from 2 independent experiments. (C) Cytokine production was measured in the supernatants of cultures described in (A); combined results from 3 independent experiments. (D) Th9 cells generated as in (A) (5 million or 1.7 million to compensate for increased percentage of cells expressing IL-9 in the presence of TL1A) were adoptively transferred into syngeneic recipients expressing HEL in the lens. Inflammatory changes in recipients of Th9 cells activated for 3 or 4 days in culture were evaluated by histological analysis 7 days after transfer (Mann-Whitney *p<0.05, ****p<0.0005); combined results from 3 independent experiments. (E) H&E stained eye sections are examples of mice described in (D) receiving 5 million Th9 cells, differentiated for 3 days, and a mouse with no treatment (naïve); scale bars: 400 μM for low magnification and 50 μM for high magnification enlarged from the indicated boxes; representative of 3 independent experiments. (F) Histological sections showing conjunctivitis in recipients of Th9 and TL1A-stimulated Th9 cells are representative of 3 independent experiments. (G) As in (D), 5 million transgenic T cells were transferred into recipients after 3 days of differentiation. Recipient spleens were collected at the indicated time points and donor cells identified by flow cytometry with an anti-clonotypic monoclonal antibody (1G12), specific to the donor cell TCR. Graph shows mean +/- SEM of transgenic T cell yields from 2 independent experiments. (H) Th9 cells transferred as in (D) were labeled with Cell Proliferation Dye eFluor 670 and their division in vivo determined by dye dilution at the indicated times after transfer: black line, Th9 control; gray line and shaded graph, Th9+TL1A; representative of 2 independent experiments. (I) Naïve mice or recipients of Th9 transfer as in (D) were injected with PBS or TL1A intraocularly 2 and 3 days after transfer. Eye pathology was examined at day 4 (Mann-Whitney *p<0.05, **p<0.01); combined results from at least 2 independent experiments per condition. (J) Recipients of Th9 transfer as in (D) were administered anti-TL1A antibody or hamster Ig control on days -1 and 3. Recipient eyes were analyzed on day 7 (Mann-Whitney *p<0.05); combined results from 3 independent experiments. (K) Representative examples of ocular histological sections from transfer experiments in (J).
Figure 7
Figure 7. TL1A enhances allergic lung inflammation induced by antigen-specific Th9
(A) Cytokine expression was measured in restimulated Th9-polarized OT-II T cells or Tnfrsf25-/- OT-II T cells. (B) Timeline of transfer experiment: 106 T cells were transferred into CD45.1+ congenic recipient mice and the recipient mice challenged with IT Ova 24 hours after transfer and IN Ova 48 hours after transfer. Control recipient mice were challenged with PBS. All mice were euthanized 12 hours after the last challenge. (C) Cell counts of neutrophils and eosinophils present in the BAL from each mouse are shown. (D) Representative lung histology of each group (left panel; H&E stain, 20x original magnification, black bar represents 50 μm), and summary of lung histopathology scores from the same experiment (right panel) are shown. (E) IL-9, IL-13 and IL-2 mRNA expression in the lung relative to β2M in each condition was measured by qRT-PCR. (F) Yields of total CD45.2+ donor T cells and IL-9- and IL-13-producing donor T cells per lung (left panel) are shown with representative FACS plots of IL-9 and IL-13 expression by restimulated T cells from each group (right panel). In all graphs, each point represents one mouse with the mean as a black line and significances of differences between Ova-treated groups indicated (Mann-Whitney *p<0.05, **p<0.01). A-D and F are representative of 2 independent experiments. E shows compiled results of 2 independent experiments.

References

    1. Buchan SL, Taraban VY, Slebioda TJ, James S, Cunningham AF, Al-Shamkhani A. Death receptor 3 is essential for generating optimal protective CD4(+) T-cell immunity against Salmonella. European journal of immunology. 2012;42:580–588. - PubMed
    1. Twohig JP, Marsden M, Cuff SM, Ferdinand JR, Gallimore AM, Perks WV, Al-Shamkhani A, Humphreys IR, Wang EC. The death receptor 3/TL1A pathway is essential for efficient development of antiviral CD4(+) and CD8(+) T-cell immunity. FASEB journal : official publication of the Federation of American Societies for Experimental Biology. 2012;26:3575–3586. - PMC - PubMed
    1. Cassatella MA, Pereira-da-Silva G, Tinazzi I, Facchetti F, Scapini P, Calzetti F, Tamassia N, Wei P, Nardelli B, Roschke V, Vecchi A, Mantovani A, Bambara LM, Edwards SW, Carletto A. Soluble TNF-like cytokine (TL1A) production by immune complexes stimulated monocytes in rheumatoid arthritis. Journal of immunology. 2007;178:7325–7333. - PubMed
    1. Bamias G, Siakavellas SI, Stamatelopoulos KS, Chryssochoou E, Papamichael C, Sfikakis PP. Circulating levels of TNF-like cytokine 1A (TL1A) and its decoy receptor 3 (DcR3) in rheumatoid arthritis. Clinical immunology. 2008;129:249–255. - PubMed
    1. Bamias G, Martin C, 3rd, Marini M, Hoang S, Mishina M, Ross WG, Sachedina MA, Friel CM, Mize J, Bickston SJ, Pizarro TT, Wei P, Cominelli F. Expression, localization, and functional activity of TL1A, a novel Th1-polarizing cytokine in inflammatory bowel disease. Journal of immunology. 2003;171:4868–4874. - PubMed

Publication types

MeSH terms

Substances