

Two-compartment passive frequency domain cochlea model allowing independent fluid coupling to the tectorial and basilar membranes
- PMID: 25786927
- PMCID: PMC5848829
- DOI: 10.1121/1.4908214
Two-compartment passive frequency domain cochlea model allowing independent fluid coupling to the tectorial and basilar membranes
Abstract
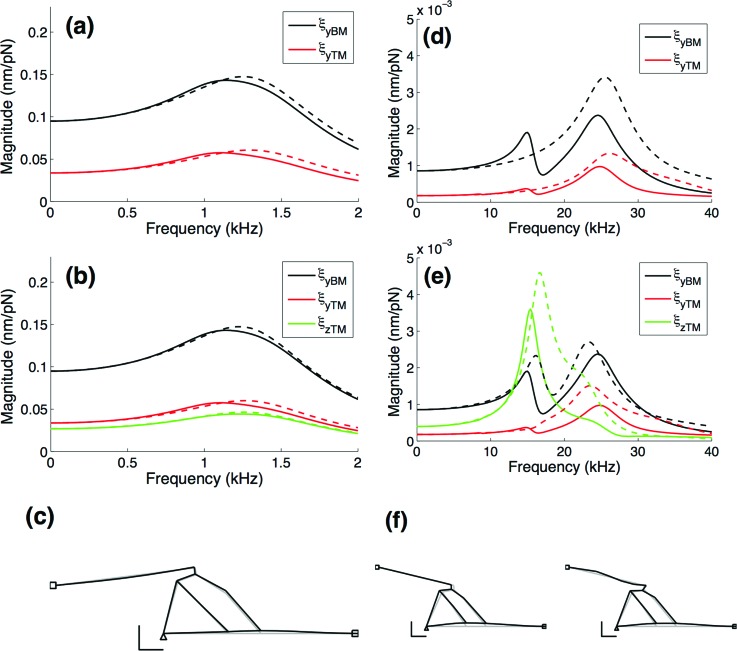
The cochlea is a spiral-shaped, liquid-filled organ in the inner ear that converts sound with high frequency selectivity over a wide pressure range to neurological signals that are eventually interpreted by the brain. The cochlear partition, consisting of the organ of Corti supported below by the basilar membrane and attached above to the tectorial membrane, plays a major role in the frequency analysis. In early fluid-structure interaction models of the cochlea, the mechanics of the cochlear partition were approximated by a series of single-degree-of-freedom systems representing the distributed stiffness and mass of the basilar membrane. Recent experiments suggest that the mechanical properties of the tectorial membrane may also be important for the cochlea frequency response and that separate waves may propagate along the basilar and tectorial membranes. Therefore, a two-dimensional two-compartment finite difference model of the cochlea was developed to investigate the independent coupling of the basilar and tectorial membranes to the surrounding liquid. Responses are presented for models using two- or three-degree-of-freedom stiffness, damping, and mass parameters derived from a physiologically based finite element model of the cochlear partition. Effects of changes in membrane and organ of Corti stiffnesses on the individual membrane responses are investigated.
Figures


Similar articles
-
Two-Dimensional Cochlear Micromechanics Measured In Vivo Demonstrate Radial Tuning within the Mouse Organ of Corti.J Neurosci. 2016 Aug 3;36(31):8160-73. doi: 10.1523/JNEUROSCI.1157-16.2016. J Neurosci. 2016. PMID: 27488636 Free PMC article.
-
Analysis of cochlear mechanics.Hear Res. 1986;22:155-69. doi: 10.1016/0378-5955(86)90091-2. Hear Res. 1986. PMID: 3733537
-
Tectorial membrane: a possible sharpening effect on the frequency analysis in the cochlea.Acta Otolaryngol. 1979 Mar-Apr;87(3-4):267-9. doi: 10.3109/00016487909126419. Acta Otolaryngol. 1979. PMID: 443008
-
The tectorial membrane of mammals.Hear Res. 1983 Mar;9(3):327-59. doi: 10.1016/0378-5955(83)90035-7. Hear Res. 1983. PMID: 6341342 Review. No abstract available.
-
Theory of cochlear mechanics.Hear Res. 1980 Jun;2(3-4):171-82. doi: 10.1016/0378-5955(80)90055-6. Hear Res. 1980. PMID: 6997254 Review.
Cited by
-
Power Dissipation in the Cochlea Can Enhance Frequency Selectivity.Biophys J. 2019 Apr 2;116(7):1362-1375. doi: 10.1016/j.bpj.2019.02.022. Epub 2019 Mar 1. Biophys J. 2019. PMID: 30878199 Free PMC article.
-
Forward and Reverse Waves: Modeling Distortion Products in the Intracochlear Fluid Pressure.Biophys J. 2018 Feb 6;114(3):747-757. doi: 10.1016/j.bpj.2017.12.005. Biophys J. 2018. PMID: 29414719 Free PMC article.
-
Intracochlear Scala Media Pressure Measurement: Implications for Models of Cochlear Mechanics.Biophys J. 2015 Dec 15;109(12):2678-2688. doi: 10.1016/j.bpj.2015.10.052. Biophys J. 2015. PMID: 26682824 Free PMC article.
-
Corti Fluid Is a Medium for Outer Hair Cell Force Transmission.J Neurosci. 2025 Jan 15;45(3):e1033242024. doi: 10.1523/JNEUROSCI.1033-24.2024. J Neurosci. 2025. PMID: 39496490 Free PMC article.
-
Anisotropic Material Properties of Wild-Type and Tectb-/- Tectorial Membranes.Biophys J. 2019 Feb 5;116(3):573-585. doi: 10.1016/j.bpj.2018.12.019. Epub 2019 Jan 5. Biophys J. 2019. PMID: 30665694 Free PMC article.
References
Publication types
MeSH terms
Grants and funding
LinkOut - more resources
Full Text Sources
Other Literature Sources