Clinical Trial
. 2015 Mar;4(2):124-36.
doi: 10.1016/j.msard.2015.01.004. Epub 2015 Jan 17.

Regional gray matter atrophy in relapsing remitting multiple sclerosis: baseline analysis of multi-center data

Collaborators, Affiliations
Clinical Trial

Regional gray matter atrophy in relapsing remitting multiple sclerosis: baseline analysis of multi-center data

Sushmita Datta et al. Mult Scler Relat Disord. 2015 Mar.

Abstract

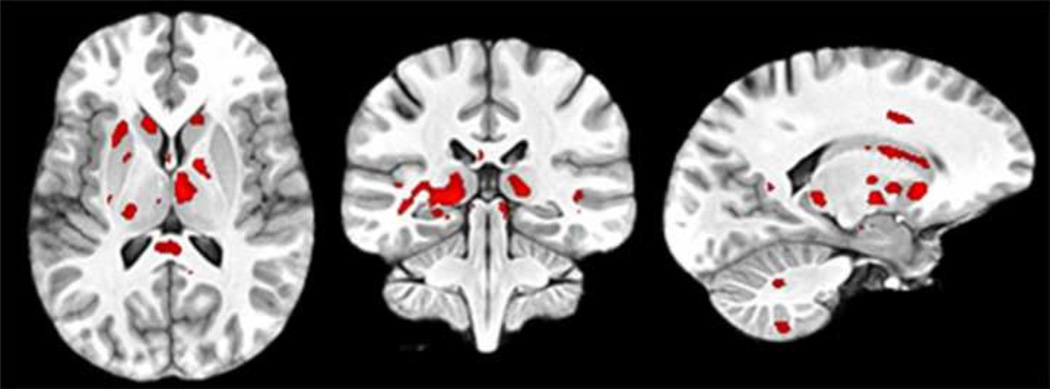
Regional gray matter (GM) atrophy in multiple sclerosis (MS) at disease onset and its temporal variation can provide objective information regarding disease evolution. An automated pipeline for estimating atrophy of various GM structures was developed using tensor based morphometry (TBM) and implemented on a multi-center sub-cohort of 1008 relapsing remitting MS (RRMS) patients enrolled in a Phase 3 clinical trial. Four hundred age and gender matched healthy controls were used for comparison. Using the analysis of covariance, atrophy differences between MS patients and healthy controls were assessed on a voxel-by-voxel analysis. Regional GM atrophy was observed in a number of deep GM structures that included thalamus, caudate nucleus, putamen, and cortical GM regions. General linear regression analysis was performed to analyze the effects of age, gender, and scanner field strength, and imaging sequence on the regional atrophy. Correlations between regional GM volumes and expanded disability status scale (EDSS) scores, disease duration (DD), T2 lesion load (T2 LL), T1 lesion load (T1 LL), and normalized cerebrospinal fluid (nCSF) were analyzed using Pearson׳s correlation coefficient. Thalamic atrophy observed in MS patients compared to healthy controls remained consistent within subgroups based on gender and scanner field strength. Weak correlations between thalamic volume and EDSS (r=-0.133; p<0.001) and DD (r=-0.098; p=0.003) were observed. Of all the structures, thalamic volume moderately correlated with T2 LL (r=-0.492; P-value<0.001), T1 LL (r=-0.473; P-value<0.001) and nCSF (r=-0.367; P-value<0.001).

Keywords: CombiRx; Regional atrophy; Relapsing remitting multiple sclerosis; Tensor based morphometry; Unbiased template.


Conflict of interest statement

Disclosure of conflict of Interest

Sushmita Datta: None

Terrell D. Staewen: None

Stacy S. Cofield: Consultancy, Teva Neuroscience, American Shoulder and Elbow Society, MedImmune, Manitoba Health Research Council, Centocor Ortho Biotech; Paid educational presentations, Teva Neuroscience.

Gary R. Cutter: Participation of Data and Safety Monitoring Committees, All of the below organizations are focused on medical research, Apotek, Biogen-Idec, Cleveland Clinic, Glaxo Smith Klein Pharmaceuticals, Gilead Pharmaceuticals, Modigenetech/Prolor, Merck/Ono Pharmaceuticals, Merck, Neuren, PCT Bio, Revalesio, Sanofi-Aventis, Teva, Vivus, NHLBI (Protocol Review Committee), NINDS, NMSS, NICHD (OPRU oversight committee). Consulting, Speaking fees & Adviosry Boards, Alexion, Allozyne, Bayer, Consortium of MS Centers (grant), Klein-Buendel Incorporated, Genzyme, Medimmune, Novartis, Nuron Biotech, Receptos, Revalesio, Sanofi- Aventis, Spiniflex Pharmaceuticals, Teva pharmaceuticals, Xenoport.

Fred D. Lublin: Consultancy, Biogen Idec, Teva Neuroscience, Bayer HealthCare, EMD Serono, Novartis, Pfizer, Actelion, Sanofi-Aventis, Acorda, Questcor, Roche, Genentech, Celgene, Johnson & Johnson, Revalesio, Coronado Bioscience, Genzyme, MedImmune, Abbott, Bristol-Myers Squibb, Xenoport, Medicinova, Genmab, Morphosys, Avanir, Kyowa Hakko Kirin, Receptos; Grants/Grants pending, Celgene, Sanofi-Aventis, Acorda, Novartis; Speaking fees, EMD Serono, Pfizer, Teva.

Jerry S. Wolinsky: Dr Wolinsky has received compensation for service on steering committees or data monitoring boards for Eli Lilly, Novartis Pharmaceuticals, Sanofi, and Teva Pharmaceuticals; as a consultant to Acetilon, Athersys, Inc., BayerHealthCare, Celgene, Genentech, Genzyme, Novartis, F. Hoffmann-La Roche, Ltd., Jansen RND, Teva and Teva Neurosciences, and XenoPort; has received honoraria from Biogen Idec, the Consortium of Multiple Sclerosis Centers, Medscape CME, Prime, Serono Symposia International Foundation, Teva Pharmaceuticals and Teva Neuroscience; and has received or receives research support from Genzyme, Sanofi, the National Institutes of Health, the Clayton Foundation for Research, and the National Multiple Sclerosis Society through the University of Texas Health Science Center at Houston (UTHSCH) and royalties for monoclonal antibodies out-licensed to Chemicon International through UTHSCH.

Ponnada A. Narayana: Grant from Genzyme.

Figures

Figure 1
Figure 1
First row: Age distribution of MS patients and healthy controls, distribution of EDSS in MS; second row: distributions of DD, T2 LL, and T1 LL in MS.
Figure 2
Figure 2
Nonlinear registration of healthy control and MS patient to the unbiased template. First row: template, T1 of healthy control, registered T1, and logarithmic Jacobian determinant images; second row: T1 of MS subjects, lesion in-painted T1, registered T1, and logarithmic Jacobian determinant images.
Figure 3
Figure 3
Flowchart of the processing pipeline for atrophy estimation in MS. Here, pre-processing includes skull-stripping and bias correction, lesions comprises of both T2 and T1 lesions with T1 lesions being subset of T2 lesions.
Figure 4
Figure 4
TBM estimates of regional atrophy shown as color blobs superimposed on the unbiased template. The regional atrophy was determined based on the ANCOVA different sub-cohorts. First column: 924 MS vs 400 healthy controls; second column: 669 MS vs 292 controls acquired on 1.5T scanner; third column: 255 MS vs 107 controls acquired on 3T scanner; fourth column: female MS (674) vs female controls (298); and fifth row: male MS (250) vs male controls (102). Age and gender were considered as nuisance variables for ANCOVA analysis in first three groups whereas nuisance variable were age and scanner in analyses between gender groups.
Figure 5
Figure 5
TBM estimates of regional atrophy as obtained using ANCOVA analysis of MS patients having EDSS 0 (118) compared to healthy controls. Age, gender, scanner field strength, and imaging sequence were considered as nuisance variables for ANCOVA analysis.
Figure 6
Figure 6
Scatter plots of volume of thalamus with EDSS, DD, T2 LL, T1 LL, and nCSF in MS patients.

References

    1. Aubert-Broche B, Fonov V, Ghassemi R, Narayanan S, Arnold DL, Banwell B, Sled JG, Collins DL. Regional brain atrophy in children with multiple sclerosis. Neuroimage. 2011;58:409–415. - PubMed
    1. Audoin B, Zaaraoui W, Reuter F, Rico A, Malikova I, Confort-Gouny S, Cozzone PJ, Pelletier J, Ranjeva JP. Atrophy mainly affects the limbic system and the deep grey matter at the first stage of multiple sclerosis. J Neurol Neurosurg Psychiatry. 2010;81:690–695. - PubMed
    1. Avants BB, Epstein CL, Grossman M, Gee JC. Symmetric diffeomorphic image registration with cross-correlation: evaluating automated labeling of elderly and neurodegenerative brain. Medical Image Analysis. 2008;12:26–41. - PMC - PubMed
    1. Ashburner J. A Fast Diffeomorphic Image Registration Algorithm. NeuroImage. 2007;38:95–113. - PubMed
    1. Bakshi R, Benedict RH, Bermel RA, Jacobs L. Regional brain atrophy is associated with physical disability in multiple sclerosis: semiquantitative magnetic resonance imaging and relationship to clinical findings. J Neuroimaging. 2001;11:129–36. - PubMed

Publication types

LinkOut - more resources