. 2015 Mar 17;5(5):931-41.
doi: 10.1534/g3.114.015784.

Mapping Bias Overestimates Reference Allele Frequencies at the HLA Genes in the 1000 Genomes Project Phase I Data

Affiliations

Mapping Bias Overestimates Reference Allele Frequencies at the HLA Genes in the 1000 Genomes Project Phase I Data

Débora Y C Brandt et al. G3 (Bethesda). .

Abstract

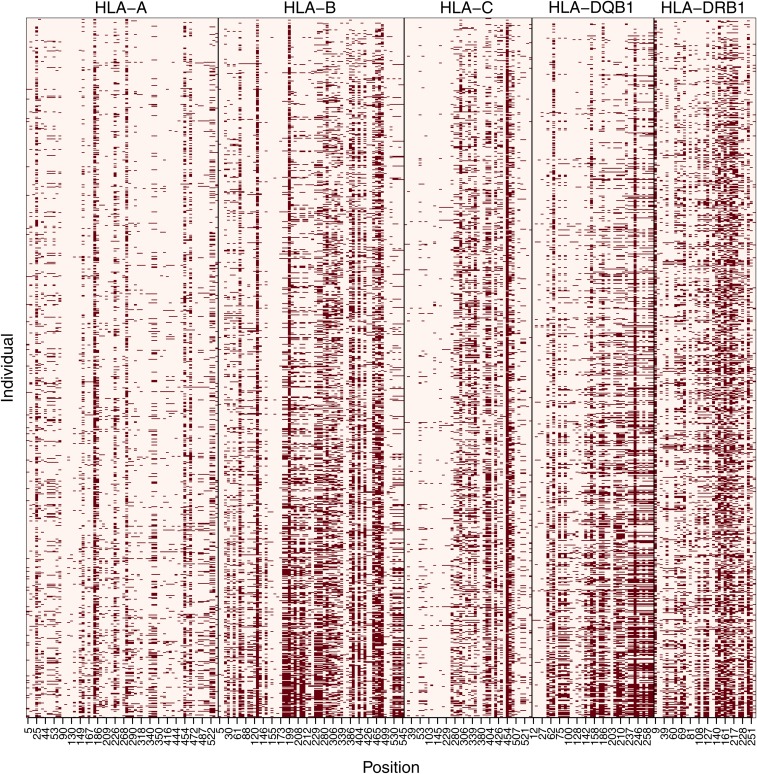
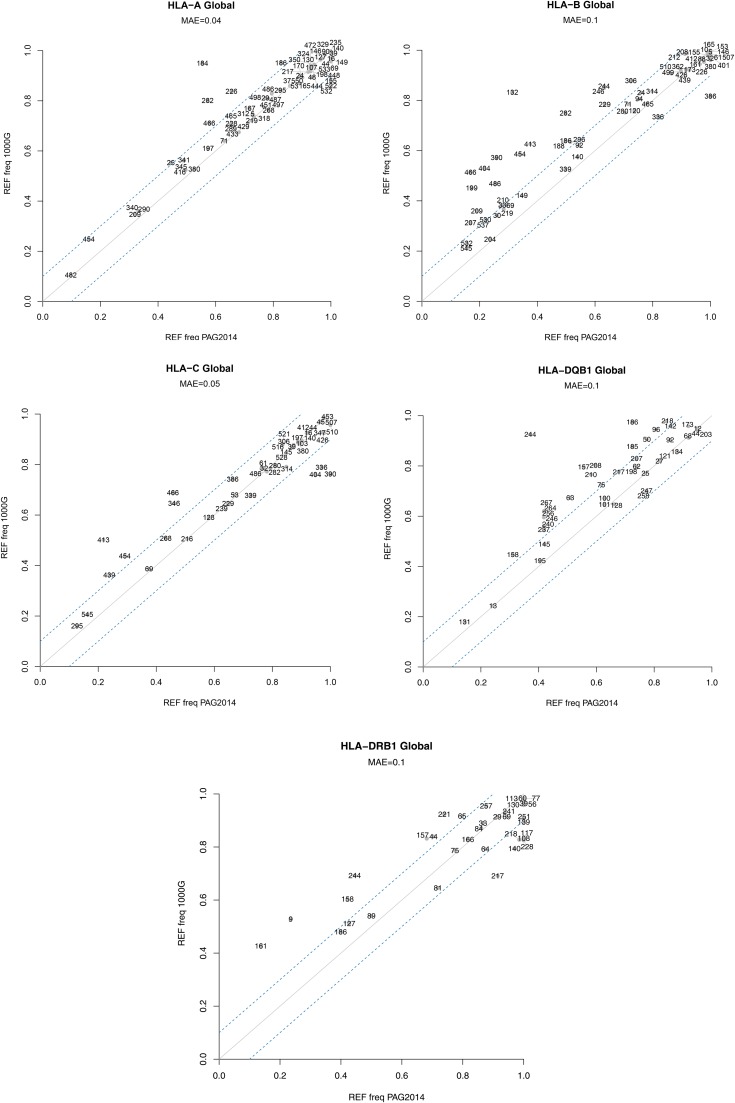
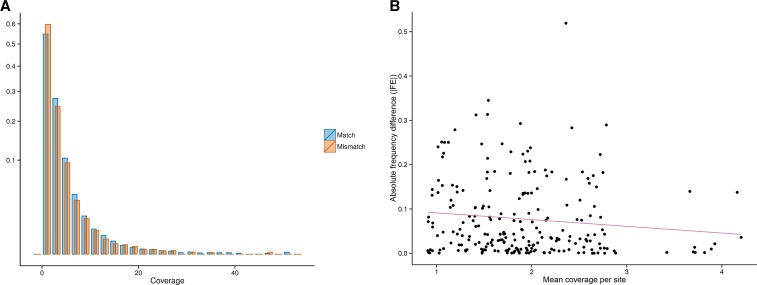
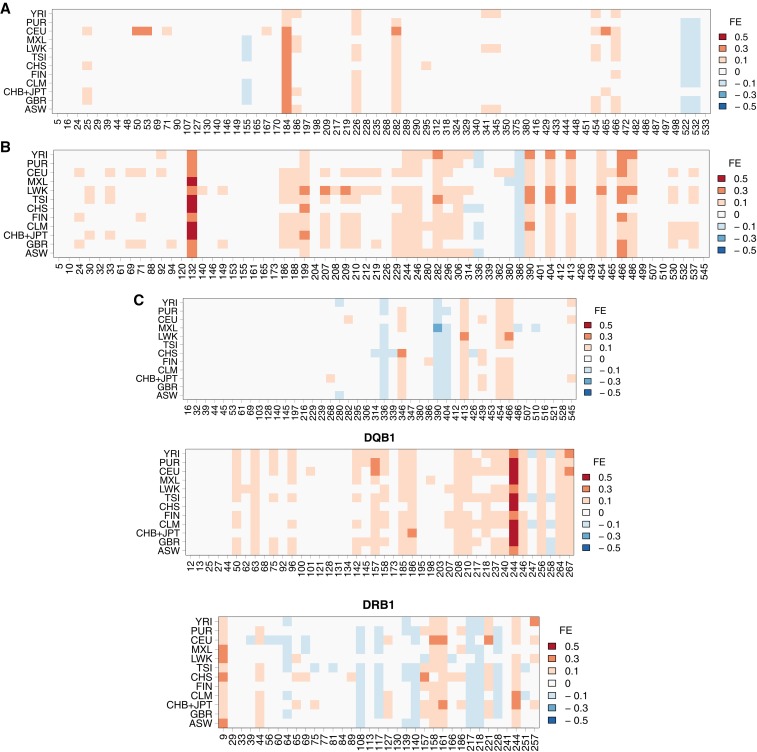
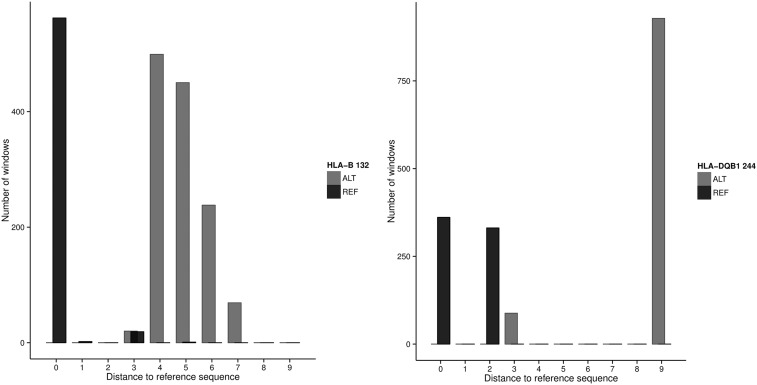
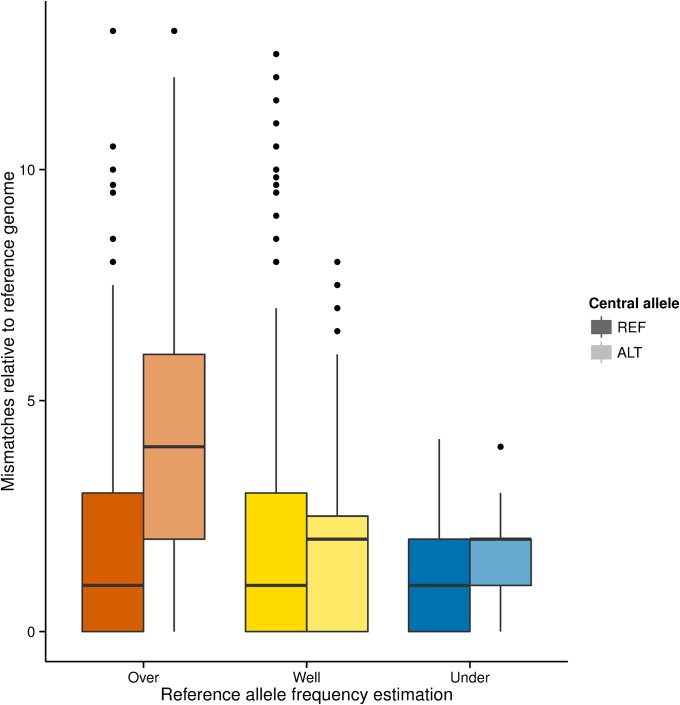
Next-generation sequencing (NGS) technologies have become the standard for data generation in studies of population genomics, as the 1000 Genomes Project (1000G). However, these techniques are known to be problematic when applied to highly polymorphic genomic regions, such as the human leukocyte antigen (HLA) genes. Because accurate genotype calls and allele frequency estimations are crucial to population genomics analyses, it is important to assess the reliability of NGS data. Here, we evaluate the reliability of genotype calls and allele frequency estimates of the single-nucleotide polymorphisms (SNPs) reported by 1000G (phase I) at five HLA genes (HLA-A, -B, -C, -DRB1, and -DQB1). We take advantage of the availability of HLA Sanger sequencing of 930 of the 1092 1000G samples and use this as a gold standard to benchmark the 1000G data. We document that 18.6% of SNP genotype calls in HLA genes are incorrect and that allele frequencies are estimated with an error greater than ±0.1 at approximately 25% of the SNPs in HLA genes. We found a bias toward overestimation of reference allele frequency for the 1000G data, indicating mapping bias is an important cause of error in frequency estimation in this dataset. We provide a list of sites that have poor allele frequency estimates and discuss the outcomes of including those sites in different kinds of analyses. Because the HLA region is the most polymorphic in the human genome, our results provide insights into the challenges of using of NGS data at other genomic regions of high diversity.

Keywords: 1000 Genomes; HLA; NGS; mapping bias.


Figures

Figure 1
Figure 1
Genotype mismatches between the 1000G and PAG2014 datasets. Results per polymorphic site (“Position”) and per individual (930 in total). Individuals are ordered by number of mismatches (individuals with less mismatches on top). Sites are numbered according to their position in ARS exons coding sequence. Dark squares indicate mismatches between genotypes in the two datasets. ARS, antigen recognition sites; HLA, human leukocyte antigen.
Figure 2
Figure 2
REF allele frequency per site in each HLA gene in the 1000 Genomes (1000G) and Sanger sequencing (PAG2014) datasets. Continuous line indicates the expected relationship (i.e., no difference) between 1000G and PAG2014. Dashed lines indicate a ±0.1 deviation from the expected frequency (as estimated from PAG2014 dataset). MAE (mean absolute error) defined in the section Materials and Methods. Numbers indicate site position in ARS exons sequence. REF, reference; ARS, antigen recognition sites; HLA, human leukocyte antigen.
Figure 3
Figure 3
(A) Distribution of coverage (x-axis) at matched and mismatched genotypes; y-axis is the square root of the relative frequency (Mann-Whitney U one-tailed test, P < 10−16); (B) Relationship between mean coverage (x-axis) and absolute frequency difference (|FE|, y-axis) between 1000G and PAG2014 (r = −0.11, P = 0.09). All polymorphic sites from HLA-A, -B, -C, -DRB1, and -DQB1 genes are included in both a and b. HLA, human leukocyte antigen.
Figure 4
Figure 4
Difference in reference allele frequency between 1000G and PAG2014, measured by FE (see the section Materials and Methods), at each polymorphic site, in each population. Shades of red indicate overestimation of reference allele frequency and shades of blue indicate underestimation of reference allele frequency in 1000G. Full population names are given in Table S3.
Figure 5
Figure 5
Number of differences to the reference genome at 1860 51-bp windows centered at sites HLA-B 132 and HLA-DQB1 244 with reference (REF) or alternative (ALT) allele at those sites. Windows were defined from all HLA alleles present in the 930 samples from the PAG2014 dataset. HLA, human leukocyte antigen.
Figure 6
Figure 6
Number of differences to the reference genome at 51-bp windows centered at each SNP in the HLA-A, -B, and -DQB1 genes. Windows around each SNP were defined from the set of 1860 alleles present in the 930 samples from the PAG2014 dataset. Next, the set of windows was divided in three groups: those centered on SNPs with overestimated, well estimated and underestimated reference allele frequencies (red, yellow and blue boxplots, respectively). Then, each group was divided in two: windows in which the central site contains the reference allele (REF, dark boxplots) and windows centered on an alternative allele (ALT, light colored boxplots). Upper and lower hinges correspond to the 25th and 75th percentiles, horizontal lines represent the median, whiskers are 1.5 times the interquartile range, and outliers are represented by dots. HLA, human leukocyte antigen; SNP, single-nucleotide polymorphism.
Figure 7
Figure 7
Heterozygosity of SNPs at HLA genes estimated from the PAG2014 dataset. Orange bars show distribution of heterozygosity at sites with a high error rate in frequency estimation (|FE|>0.1 in two or more populations). Blue bars show the distribution of heterozygosity after exclusion of SNPs with high error rate. SNP, single-nucleotide polymorphism; HLA, human leukocyte antigen.
Figure 8
Figure 8
Relationship between SNP heterozygosity (H) and (A) absolute value of deviation (|FE|; Pearson’s correlation = 0.32; P = 1.938 × 10⁻⁷) or (B) magnitude and direction of deviation (FE; Pearson’s correlation = 0.59; P < 10−16). SNP, single-nucleotide polymorphism.

References

    1. Andersen K. G., Shylakhter I., Tabrizi S., Grossman S. R., Happi C. T., et al. , 2012. Genome-wide scans provide evidence for positive selection of genes implicated in Lassa fever. Philos. Trans. R. Soc. Lond. B Biol. Sci. 367: 868–877. - PMC - PubMed
    1. Bjorkman P. J., Saper M. A., Samraoui B., Bennett W. S., Strominger J. L., et al. , 1987. Structure of the human class I histocompatibility antigen, HLA-A2. Nature 329: 506–512. - PubMed
    1. Boegel S., Löwer M., Schäfer M., Bukur T., de Graaf J., et al. , 2012. HLA typing from RNA-Seq sequence reads. Genome Med. 4: 102. - PMC - PubMed
    1. Brown J. H., Jardetzky T. S., Gorga J. C., Stern L. J., Urban R. G., et al. , 1993. Three-dimensional structure of the human class II histocompatibility antigen HLA-DR1. Nature 364: 33–39. - PubMed
    1. Chapman S. J., Hill A. V. S., 2012. Human genetic susceptibility to infectious disease. Nat. Rev. Genet. 13: 175–188. - PubMed

Publication types