. 2015 Mar 19:5:9253.
doi: 10.1038/srep09253.

Phytonutrient diet supplementation promotes beneficial Clostridia species and intestinal mucus secretion resulting in protection against enteric infection

Affiliations

Phytonutrient diet supplementation promotes beneficial Clostridia species and intestinal mucus secretion resulting in protection against enteric infection

Marta Wlodarska et al. Sci Rep. .

Abstract

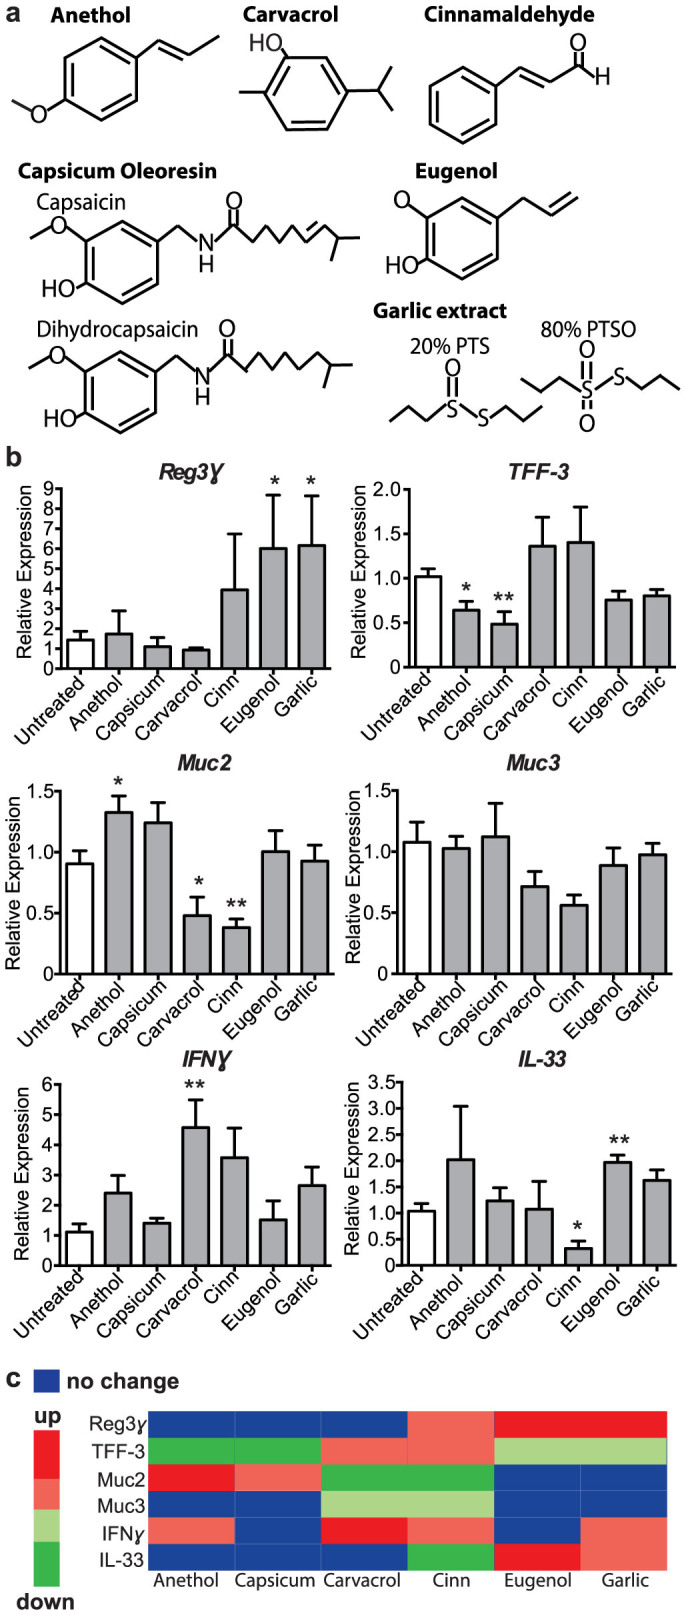
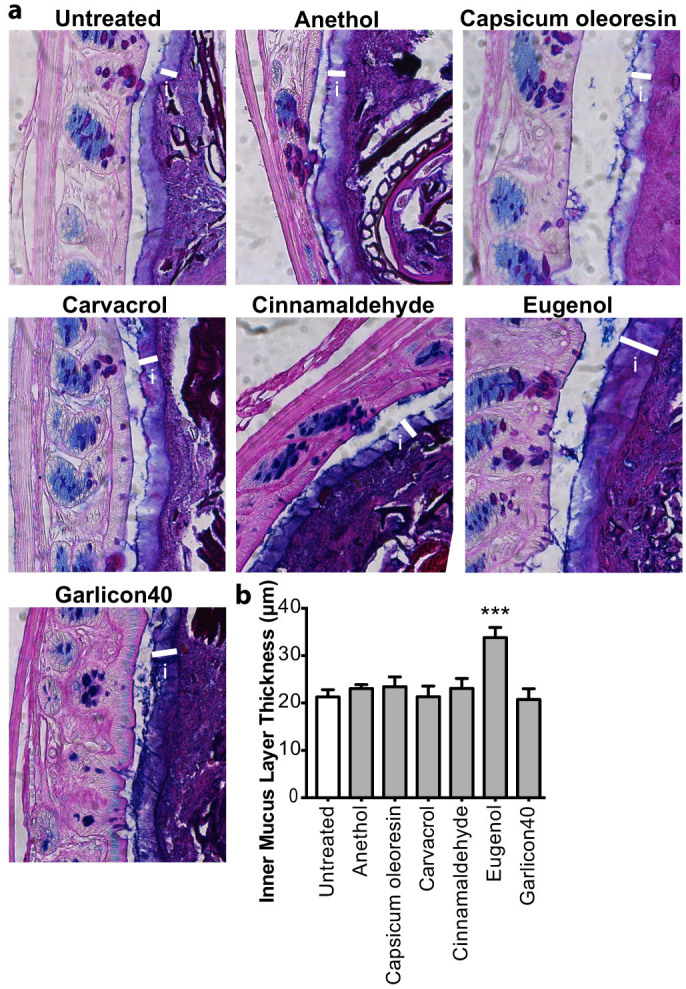
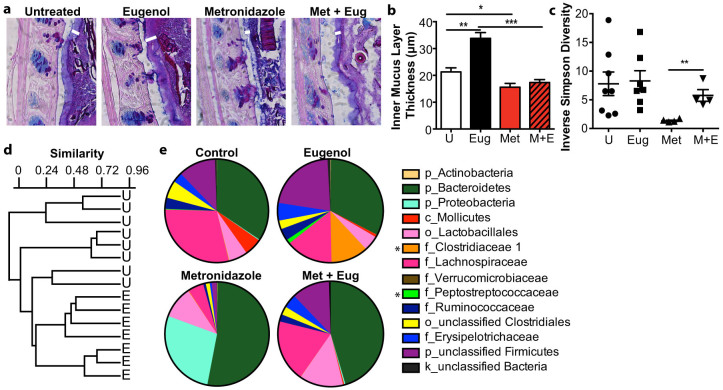
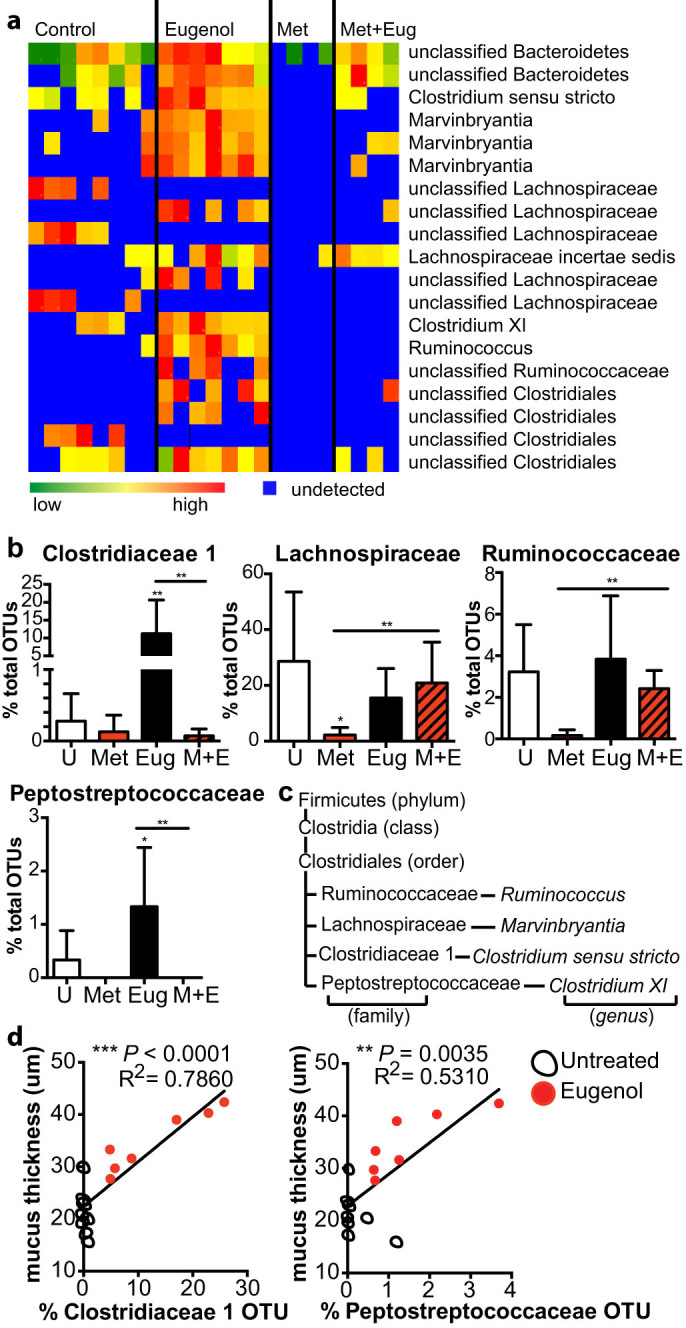
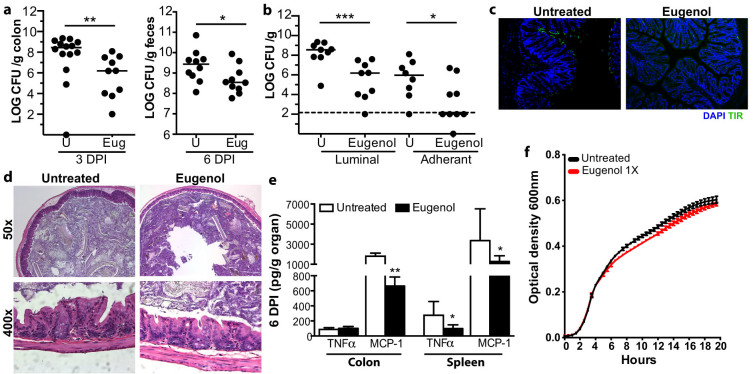
Plant extracts, or phytonutrients, are used in traditional medicine practices as supplements to enhance the immune system and gain resistance to various infectious diseases and are used in animal production as health promoting feed additives. To date, there are no studies that have assessed their mechanism of action and ability to alter mucosal immune responses in the intestine. We characterized the immunomodulatory function of six phytonutrients: anethol, carvacrol, cinnamaldehyde, eugenol, capsicum oleoresin and garlic extract. Mice were treated with each phytonutrient to assess changes to colonic gene expression and mucus production. All six phytonutrients showed variable changes in expression of innate immune genes in the colon. However only eugenol stimulated production of the inner mucus layer, a key mucosal barrier to microbes. The mechanism by which eugenol causes mucus layer thickening likely involves microbial stimulation as analysis of the intestinal microbiota composition showed eugenol treatment led to an increase in abundance of specific families within the Clostridiales order. Further, eugenol treatment confers colonization resistance to the enteric pathogen Citrobacter rodentium. These results suggest that eugenol acts to strengthen the mucosal barrier by increasing the thickness of the inner mucus layer, which protects against invading pathogens and disease.


Figures

Figure 1
Figure 1. Phytochemical treatment results in pleiotropic effects on intestinal gene expression.
(a), Chemical structures of the phytonutrients administered in the drinking water of mice. (b), Quantitative RT-PCR results shown of Reg3γ (*p = 0.0499; *p = 0.0340), TFF-3 (*p = 0.0229; **p = 0.0074), Muc2 (*p = 0.0421; *p = 0.0453; **p = 0.0092), Muc3, IFNγ (**p = 0.0075), and IL-33 (*p = 0.0129; **p = 0.0036) expression relative to GAPDH in tissue from the distal colon of untreated and phytonutrient treated mice, n = 4 mice per group. Significance determined using two-tailed Student's t-test and expressed as the mean ± SEM. p-values listed as they occur in the graph left to right. Cinn = cinnamaldehyde; Capsicum = capsicum oleoresin. (c), Heat map showing the effect of phytonutrient administration to changes in colonic gene expression. Significant changes (p < 0.05) shown as bright green or red, trends shown as pale green or red, and no change shown with blue. Cinn = cinnamaldehyde; Capsicum = capsicum oleoresin.
Figure 2
Figure 2. Eugenol treatment results in thickening of the inner mucus layer.
(a), AB/PAS stained methanol-Carnoy's fixed distal colon sections showing the inner mucin layer (white bars). i = inner mucus layer. Original magnification = 400×. (b), Quantification of inner mucus layer thickness. Distal colon sections stained with AB/PAS to visualize and quantify the inner mucus layer. n = 5–10 mice per group. (*p = 0.038; ***p = 0.0003) U = untreated mice. Significance determined using two-tailed Student's t-test and expressed as the mean ± SEM.
Figure 3
Figure 3. Eugenol treatment when combined with metronidazole prevents mucus thickening and highlights the importance of microbial factors.
(a), AB/PAS stained methanol-Carnoy's fixed distal colon sections showing the inner mucin layer (white arrowheads). i = inner mucus layer. Original magnification = 400×. (b), Quantification of inner mucus layer thickness. Distal colon sections stained with AB/PAS to visualize and quantify the inner mucus layer. n = 5–10 mice per group. (*p = 0.038, ***p = 0.0003, ***p = 0.0001) U = untreated mice. Significance determined using two-tailed Student's t-test and expressed as the mean ± SEM. (c), Simpson's Reciprocal Index of diversity was used to determine diversity of fecal communities after treatment with eugenol, metronidazole, metronidazole and eugenol or untreated mice. n = 4–8. U = untreated mice. (**p = 0.0048). (d), Similarity between the microbiota of untreated and eugenol treated feces was measured by Bray-Curtis index and depicted in a dendogram. U = untreated, E = eugenol treated. (e), Family level phylogenetic classification of 16S rRNA gene frequencies in feces collected from untreated, eugenol, metronidazole or combined treatment. Those indicated with a classification level other than family level could only be identified confidently to the level indicated. Classification scheme: k, kingdom; p, phylum; c, class; o, order; f, family. Representative data is shown for each group, n = 4–8. Stars indicate significant family changes between eugenol and untreated mice (p < 0.05).
Figure 4
Figure 4. Eugenol specifically increases the abundance of the Clostridiaceae 1 and Peptostreptococcaceae families.
(a), Heatmap showing the relative abundance of fecal bacterial OTUs that differed between mice treated with eugenol, metronidazole, combination of both or untreated mice (P < 0.05). Classification scheme: p, phylum; c, class; o, order; f, family; g, genus. (b), Abundances of OTUs that increased with eugenol treatment, including the Clostridiaceae 1 (Eug: **p = 0.0016, Eug vs. Met + Eug: **p = 0.0062), Lachnospiraceae (*p = 0.0127, **p = 0.0043), Peptostreptococcaceae (*p = 0.0127, **p = 0.0043), and Ruminococcaceae (**p = 0.0043) families. Data represented as percent of total OTUs. U = untreated mice. M + E = metronidazole and eugenol treated mice. (c), The miniature phylogeny tree shows the specific families belonging to the Clostridiales order and any relevant genera whose abundance is increased with eugenol treatment. Brackets indicate the classification. (d), Linear regression analysis showing the correlation of mucus thickness with abundance of Clostridiaceae or Peptostreptococcaceae.
Figure 5
Figure 5. Eugenol treatment reduces C. rodentium burden in the colon.
(a), Enumeration of C. rodentium in the colon and feces at day 3 and day 6 p.i., respectively. Each data point represents one individual. Results are pooled from two separate infections, n = 10–13 per group. Significance determined using the Mann-Whitney U-test and expressed as the median. U = untreated mice. (**p = 0.0048; *p = 0.0431). (b), Both luminal (fecal matter) and adherent (extensively washed colons) bacterial colonization is reduced in eugenol treated mice at day 3 p.i. Results are pooled from two separate experiments, n = 9 per group. Significance determined using the Mann-Whitney U-test and expressed as the median. (*p = 0.05; ***p < 0.0008) U = untreated mice. Dashed line represents detection limit. U = untreated. (c), Representative immunostaining for the C. rodentium-specific effector Tir (green) in colon, with DAPI (blue) as a counter stain at 3 days p.i.. Tir staining present at day 3 p.i. in untreated mice which is absent in eugenol treated mice. Original magnification = 100×. (d), H&E stained distal colon sections from untreated and eugenol treated mice at day 3 p.i. Minor inflammation is evident in untreated and eugenol treated mice (top panel original magnification = 50×; bottom panel original magnification = 400×). (e), Cytokine and chemokine production, TNFα and MCP-1, in the colon and spleen in response to C. rodentium infection 6 days p.i. Results shown as pg of cytokine produced per gram of organ, n = 9–12 mice per group. (**p = 0.0092; TNFα *p = 0.0172; MCP-1 *p = 0.0351) Significance determined using two-tailed Student's t-test and expressed as the mean ± SEM. (f), C. rodentium was grown with or without eugenol at 13.3 ug/mL (denoted 1×) and growth was determined using optical density measurements every hour for 20 hours at 600 nm.

References

    1. Cho I. et al. Antibiotics in early life alter the murine colonic microbiome and adiposity. Nature 488, 621–626 (2012). - PMC - PubMed
    1. Clark S. et al. Extension Education Symposium: The future of biosecurity and antimicrobial use in livestock production in the United States and the role of extension. J. Anim. Sci. 90, 2861–2872 (2012). - PubMed
    1. Love D. C., Davis M. F., Bassett A., Gunther A. & Nachman K. E. Dose Imprecision and Resistance: Free-Choice Medicated Feeds in Industrial Food Animal Production in the United States. Environ. Health Perspect. 119, 279–283 (2011). - PMC - PubMed
    1. McEwen S. A. & Fedorka-Cray P. J. Antimicrobial use and resistance in animals. Clin. Infect. Dis. Off. Publ. Infect. Dis. Soc. Am. 34 Suppl 3, S93–S106 (2002). - PubMed
    1. Chami F., Chami N., Bennis S., Trouillas J. & Remmal A. Evaluation of carvacrol and eugenol as prophylaxis and treatment of vaginal candidiasis in an immunosuppressed rat model. J. Antimicrob. Chemother. 54, 909–914 (2004). - PubMed

Publication types

MeSH terms

LinkOut - more resources