. 2015 Nov;25(11):4299-309.
doi: 10.1093/cercor/bhu326. Epub 2015 Mar 18.

Validation of High-Resolution Tractography Against In Vivo Tracing in the Macaque Visual Cortex

Affiliations

Validation of High-Resolution Tractography Against In Vivo Tracing in the Macaque Visual Cortex

Hojjatollah Azadbakht et al. Cereb Cortex. 2015 Nov.

Abstract

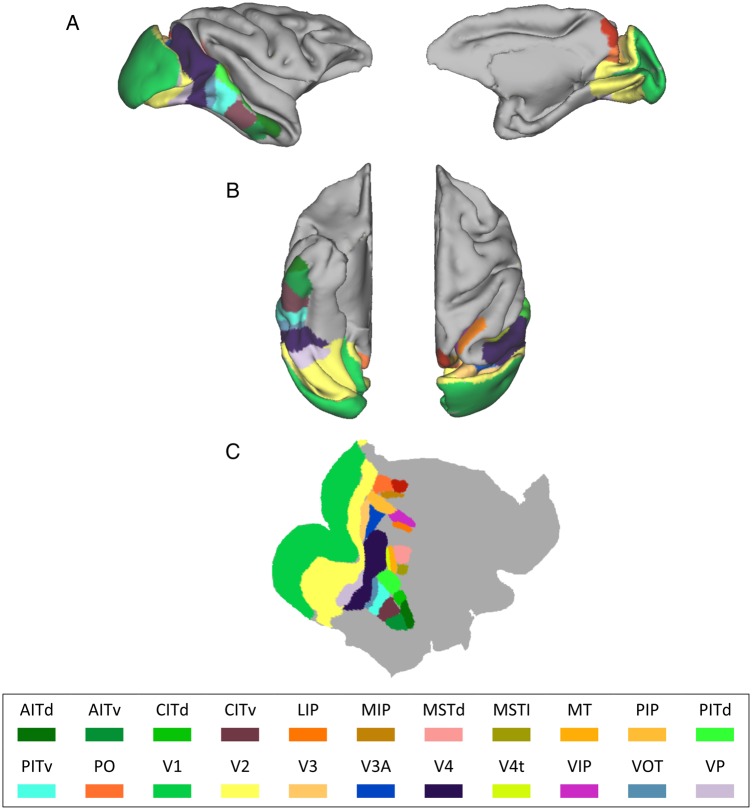
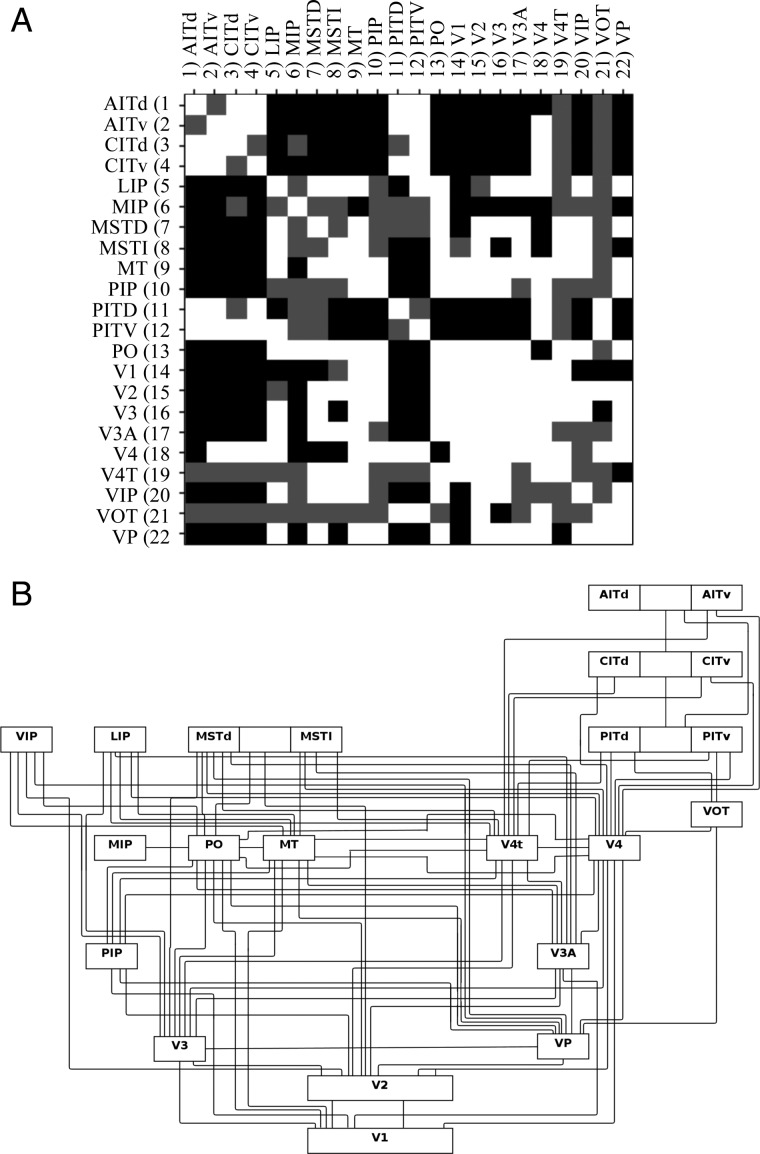
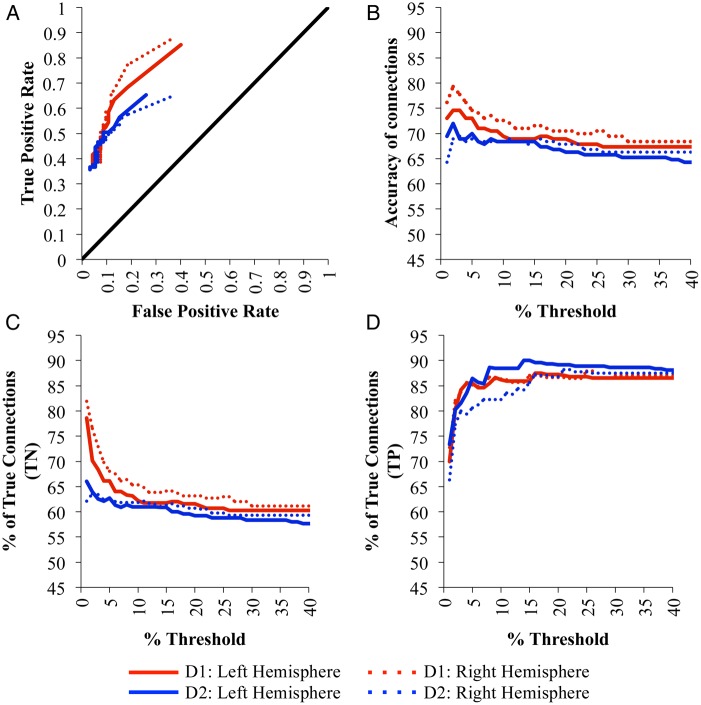
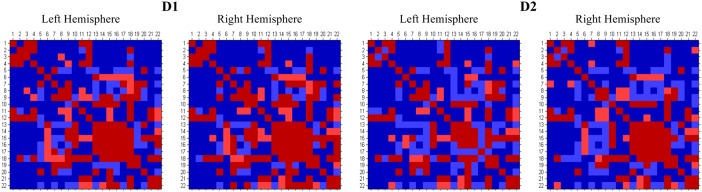
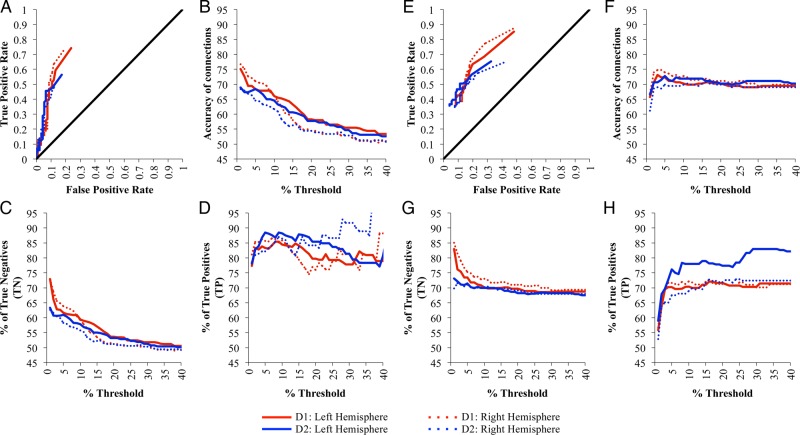
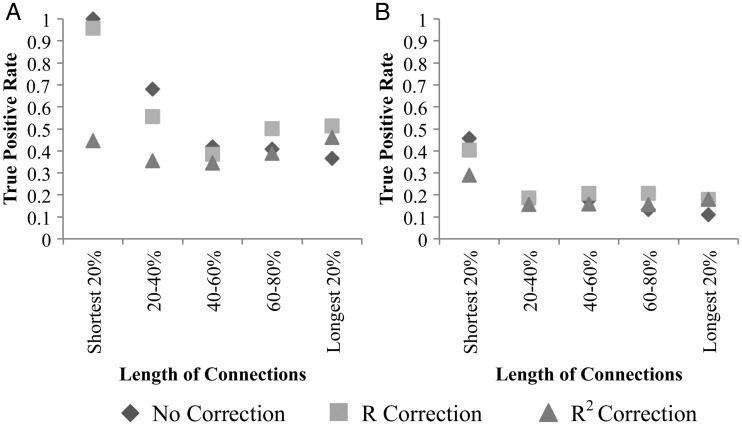
Diffusion magnetic resonance imaging (MRI) allows for the noninvasive in vivo examination of anatomical connections in the human brain, which has an important role in understanding brain function. Validation of this technique is vital, but has proved difficult due to the lack of an adequate gold standard. In this work, the macaque visual system was used as a model as an extensive body of literature of in vivo and postmortem tracer studies has established a detailed understanding of the underlying connections. We performed probabilistic tractography on high angular resolution diffusion imaging data of 2 ex vivo, in vitro macaque brains. Comparisons were made between identified connections at different thresholds of probabilistic connection "strength," and with various tracking optimization strategies previously proposed in the literature, and known connections from the detailed visual system wiring map described by Felleman and Van Essen (1991; FVE91). On average, 74% of connections that were identified by FVE91 were reproduced by performing the most successfully optimized probabilistic diffusion MRI tractography. Further comparison with the results of a more recent tracer study ( Markov et al. 2012) suggests that the fidelity of tractography in estimating the presence or absence of interareal connections may be greater than this.

Keywords: diffusion imaging; macaque; tractography; validation; visual cortex.


Figures

Figure 1.
Figure 1.
An example of the visual cortex parcellation scheme of Felleman and Van Essen. (A) Left: midsagittal view. Right: lateral view. (B) Left: ventral–axial view. Right: dorsal–axial view. (C) The regions depicted on the cortical flat map of the example macaque brain. AITd and AITv, anterior inferotemporal, dorsal and ventral; CITd and CITv, central inferotemporal, dorsal and ventral; LIP, lateral intraparietal; MIP, medial intraparietal; MSTd and MSTl, medial superior temporal, dorsal and lateral; MT, middle temporal; PIP, posterior intraparietal; PITd and PITv, posterior inferotemporal, dorsal and ventral; PO, parieto-occipital; V1, V2, V3, V4, visual areas 1,2,3,4; V3a, visual area V3a; V4t, V4 transitional; VIP, ventral intraparietal; VOT, ventral occipitotemporal; VP, ventral posterior.
Figure 2.
Figure 2.
(A) The symmetric gold standard connection matrix with regions in an alphabetical order, where white indicates a true connection, black no connection, and gray indeterminate. (B) The wiring diagram representations of the in vivo connections from Felleman and Van Essen with labels for different regions as defined in that work.
Figure 3.
Figure 3.
(A) The average receiver operating characteristic (ROC) for SCI matrices at a range of acceptance thresholds in comparison with FVE91. (B) Accuracy of connections from the SCI matrices at a range of acceptance thresholds from 1 to 40%, compared with FVE91. (C) Percentage of TN and (D) % of TP connections identified when optimizing the SCI matrices generated for D1 and D2 against the Felleman and Van Essen atlas. Note that results are only shown for acceptance thresholds between 1 and 40%, although the full range of threshold levels up to 100% was tested.
Figure 4.
Figure 4.
Comparison of the thresholded connection matrices generated for D1 and D2 against the Felleman and Van Essen atlas (Fig. 2A). Regions are provided in an alphabetical order, as defined in Figure 2.
Figure 5.
Figure 5.
Effect of distance correction, R-correction (AD) and R2-correction (EH) on: (A and E) the average ROC for SCI matrices at a range of acceptance thresholds in comparison with FVE91. (B and F) Accuracy of connections from the SCI matrices at a range of acceptance thresholds from 1% to 40%, compared with FVE91. (C and G) Percentage of TN and (D and H) % of TP connections identified when optimizing the SCI matrices generated for D1 and D2 against the Felleman and Van Essen atlas. Note that results are only shown for acceptance thresholds between 1 and 40%, although the full range of threshold levels up to 100% was tested.
Figure 6.
Figure 6.
(A) TP rates and (B) FP rates when using no correction, R-correction, and R2-correction, as a function of distance away from the ROI seed point averaged across D1 and D2.

References

    1. Abe O, Masutani Y, Aoki S, Yamasue H, Yamada H, Kasai K, Mori H, Hayashi N, Masumoto T, Ohtomo K. 2004. Topography of the human corpus callosum using diffusion tensor tractography. J Comput Assist Tomogr. 284:533–539. - PubMed
    1. Abramoff MD, Magalhaes PJ, Ram SJ. 2004. Image processing with Image. J Biophotonics Int. 117:36–42.
    1. Alexander DC. 2005. Multiple-fiber reconstruction algorithms for diffusion MRI. Ann N Y Acad Sci. 10641:113–133. - PubMed
    1. Aron AR, Behrens TE, Smith S, Frank MJ, Poldrack RA. 2007. Triangulating a cognitive control network using diffusion-weighted magnetic resonance imaging (MRI) and functional MRI. J Neurosci. 2714:3743–3752. - PMC - PubMed
    1. Basser PJ, Mattiello J, LeBihan D. 1994. MR diffusion tensor spectroscopy and imaging. Biophys J. 661:259–267. - PMC - PubMed

Publication types