. 2015 Jun;75(6):621-40.
doi: 10.1002/dneu.22288. Epub 2015 Mar 30.

Spatial pattern of spontaneous retinal waves instructs retinotopic map refinement more than activity frequency

Affiliations

Spatial pattern of spontaneous retinal waves instructs retinotopic map refinement more than activity frequency

Hong-Ping Xu et al. Dev Neurobiol. 2015 Jun.

Abstract

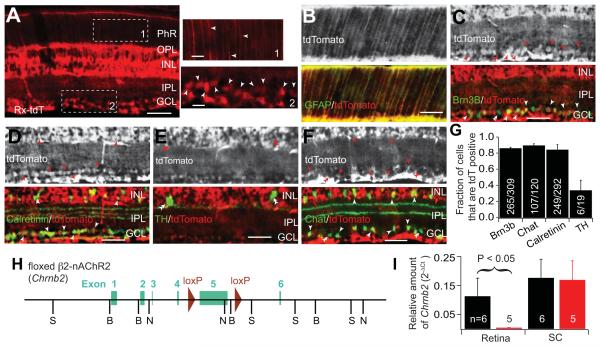
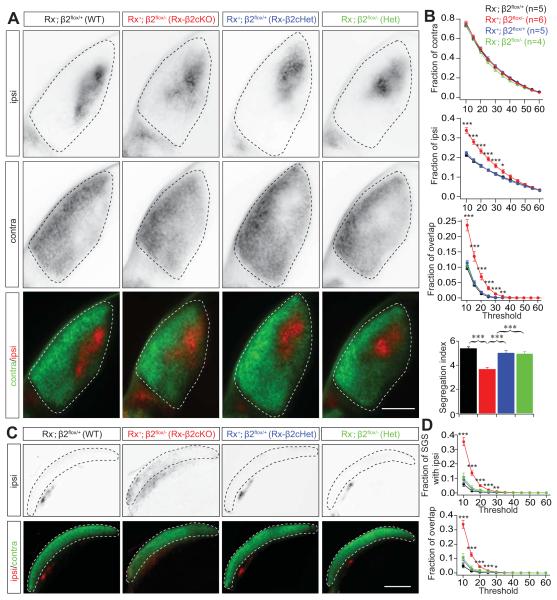
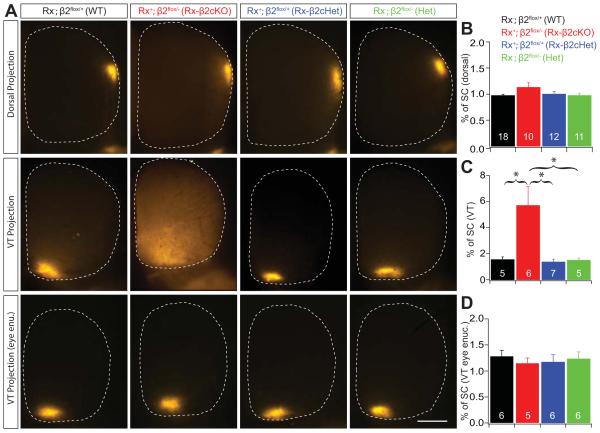
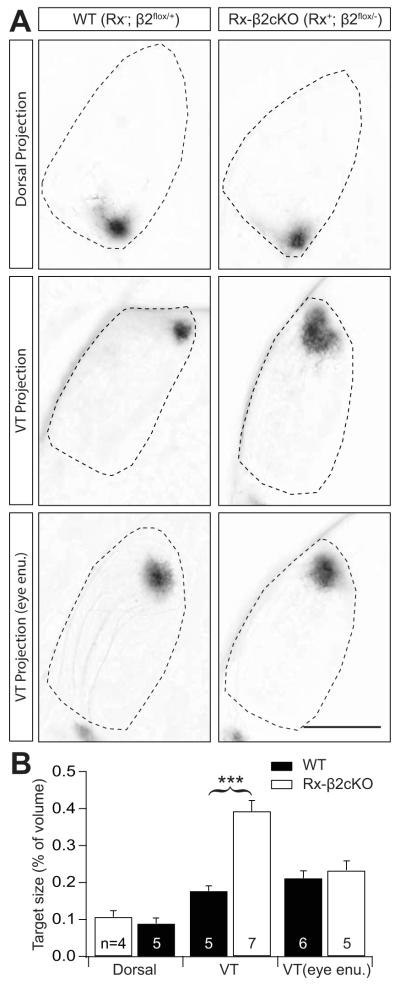
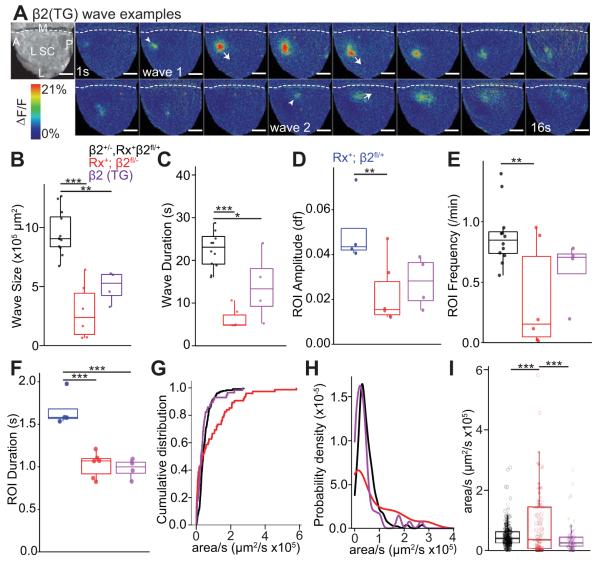
Spontaneous activity during early development is necessary for the formation of precise neural connections, but it remains uncertain whether activity plays an instructive or permissive role in brain wiring. In the visual system, retinal ganglion cell (RGC) projections to the brain form two prominent sensory maps, one reflecting eye of origin and the other retinotopic location. Recent studies provide compelling evidence supporting an instructive role for spontaneous retinal activity in the development of eye-specific projections, but evidence for a similarly instructive role in the development of retinotopy is more equivocal. Here, we report on experiments in which we knocked down the expression of β2-containing nicotinic acetylcholine receptors (β2-nAChRs) specifically in the retina through a Cre-loxP recombination strategy. Overall levels of spontaneous retinal activity in retina-specific β2-nAChR mutant mice (Rx-β2cKO), examined in vitro and in vivo, were reduced to a degree comparable to that observed in whole animal β2-nAChR mouse mutants (β2KO). However, many residual spontaneous waves in Rx-β2cKO mice displayed local propagating features with strong correlations between nearby but not distant RGCs typical of waves observed in wild-type (WT) but not β2KO mice. We further observed that eye-specific segregation was disrupted in Rx-β2cKO mice, but retinotopy was spared in a competition-dependent manner. These results suggest that propagating patterns of spontaneous retinal waves are essential for normal development of the retinotopic map, even while overall activity levels are significantly reduced, and support an instructive role for spontaneous retinal activity in both eye-specific segregation and retinotopic refinement.

Keywords: activity-dependent; retinotopy; vision.


Figures

Figure 1
Figure 1. Reduced Chrnb2 transcription in retina of Rx-β2cKO mice
(A-G) Expression of Cre in retina driven by Rx promoter. (A) Cre expression was examined by crossing Rx-Cre mice with a tdTomato reporter mouse. Cre was strongly expressed in the ganglion cell layer (GCL) and inner nuclear layer (INL). Fluorescence was also found in the inner plexiform layer (IPL) and outer plexiform layer (OPL). Representative areas in the photoreceptor layer (PhR) and the GCL, indicated by area 1 and 2, respectively, are enlarged and shown at right. Arrowheads indicate radial fibers extending into the PhR layer and somas in the GCL, respectively. (B) The radial extending filaments were likely Müller glia cells as they were co-localized with glial filbrillary acidic protein (GFAP). (C-F) Co-localization of tdTomato with Brn3B, Calretinin, Tyrosine Hydroxylase (TH) and Choline Acetyltransferase (Chat) in the INL and the GCL. Single arrowheads indicate immunostained neurons expressing tdTomato and double arrowheads indicate inmmunolabeled neurons that did not express tdTomato. (G) Fraction of Brn3B, Chat, Calretinin, and TH positive cells that also expressed tdTomato. (H) Design of floxed β2-nAChR (floxed Chrnb2) mice. Two loxP sites were incorporated into the targeted Chrnb2 gene flanking approximately 2.2 kb DNA surrounding exon 5. (I) The relative amount of Chrnb2 mRNA was significantly reduced in the retina of Rx-β2cKO mice compared to wild type controls. However, Chrnb2 mRNA levels were comparable in the SC of Rx-β2cKO and control mice. Scale = 50 μm.
Figure 2
Figure 2. Truncated spontaneous retinal activity in Rx-β2cKO mice
(A) Retinal wave-imaging schematic. Retinal waves were imaged in vivo in topographically mapped axon arbors of RGCs in the upper layers of the SC through a craniotomy. Calcium activity in RGC axons in the SC were measured through viral expression of GCaMP6 in RGCs. (B) Example single-wave montages from a P5 conditional heterozygous (Rx-Cre+,β2flox/+ : Rx-β2cHet) mouse. Grayscale images on left (top) show craniotomy over the SC. White arrowhead shows onset and arrows indicate propagation of retinal wave front. A clear propagating wave front was typical in heterozygous mice. Movie frames shown in montage at 2s interval. All movies were acquired at 5 Hz. (C) Raster plot of 10 min recordings from the same mouse. Each row in the raster corresponds to one 10×10 μm region of interest (ROI) in the indicated hemisphere. (D) Example single-wave montage from a P5 conditional knockout (Rx-Cre+,β2flox/− : Rx-β2cKO) mouse. Grayscale images on left (top) show craniotomies over SC. White arrowhead shows onset and arrows indicate propagation of retinal wave front. In this particular case, a small wave propagated over the SC with a noticeable wave front. Movies were acquired at 5 Hz and frames in montage are at 1s intervals. Scale bars, 200 μm. (E) Raster plot of 10 min recordings from the mouse shown in D. Each row in the raster corresponds to one 10×10 μm region of interest in the indicated hemisphere. Some small wave activity (as indicated by red dashed lines) in Rx-β2cKO mice show typical, slow, propagating dynamics, whereas the large waves (examples outlined by blue dashed lines) demonstrate fast, “flashy” dynamics. Spontaneous activity was less frequent (F) and of lower amplitude (G) in Rx-β2cKOs and β2KOs compared with their heterozygous controls. (H) Average wave size was much smaller in Rx-β2cKOs than their littermate heterozygous controls. P<0.01, student t-test, comparing between Rx-β2cKO and littermate heterozygous controls, and P >0.05 comparing between β2KOs and littermate heterozygous controls. (I) Wave durations were shorter in Rx-β2cKOs and β2KOs than their littermate heterozygous controls, respectively. P<0.05, student t-test, comparing between Rx-β2cKO and its littermate heterozygous controls, and between β2KOs and their littermate heterozygous controls. (J) The duration of spontaneous activity measured in each ROI was shorter in Rx-β2cKOs but not β2KOs compared with their heterozygous controls. (K) and (L) Cumulative distribution and histograms of wave propagation speed (measured by coverage area per second), respectively. Spontaneous wave activity in heterozygous mice (both β2+/− and β2flox/+, Rx-Cre+) had homogeneous propagating dynamics, with a narrowly distributed peak between 0 and 1 μm2/s. In contrast, the propagation speed in β2KO mice is significantly higher than in heterozygous controls, peaking between 1 and 2 μm2/s. Most spontaneous waves in Rx-β2cKO mice propagate normally, with a peak between 0 and 1 μm2/s, while some waves rapidly sweep through the SC, like in β2KO mice, generating a wide distribution with a peak similar to the β2 heterozygous controls and a long tail more typical of β2KO mice. (M) The average wave propagation speed in Rx-β2cKO mice was faster than that of Rx-β2cHET mice, but was slightly slower than in β2KO mice. Scale = 400 μm.
Figure 3
Figure 3. Weak and less regular Ca2+ activity in vitro in Rx-β2cKO mice
(A) and (B) Example spontaneous calcium activity imaged in vitro in retinas of a Rx-β2cHet (β2flox/+; Rx-Cre+) and a Rx-β2cKO mouse, respectively, at P5. Representative calcium images of spontaneous wave activity in top panels and calcium events of five example neurons (circled in red) plotted in bottom panels. Calcium events were highly correlated throughout the recording in heterozygous retinas. Although correlated calcium events (black dashed line boxes) were also found in Rx-β2cKOs, many events with relatively small amplitude (red dashed line boxes) occurred outside of correlated wave activity. (C) Histograms of the amplitudes of calcium events in Rx-β2cHets and Rx-β2cKOs at P5-6. Inset shows the mean amplitudes of calcium events in these two genotypes. The amplitude of calcium events was significantly smaller in Rx-β2cKOs than in heterozygous controls (P<0.0001, K-S test and Student t-test for cumulative distribution and mean, respectively). (D) Histograms of inter-event intervals of Rx-β2cHet and Rx-β2cKO mice. Inset, mean inter-event interval of calcium activities. Calcium events occurred irregularly in the Rx-β2cKOs relative to heterozygous controls as demonstrated by a broader distribution (P<0.001, K-S test). However, the mean inter-event interval was comparable between Rx-β2cKOs and heterozygous controls (P>0.05, Student t-test). Scale = 50 μm.
Figure 4
Figure 4. Reduced spiking activity in Rx-β2cKO retinas
RGC spiking activity was measured in vitro using a multielectrode array system. (A) Examples of bursting activity in seven RGCs recorded from a Rx-β2cHet control (top) and a Rx-β2cKO (bottom) mouse retina at P4. RGC activity was synchronized across the entire multielectrode array (shown in grey at right) in the Rx-β2cHet control, while many bursts were only locally correlated in the Rx-β2cKO. (B) Spike time tiling coefficient (STTC) for RGC activity in Rx-β2cKOs (red) and Rx-β2cHet (black) controls. The spontaneous activity in neighboring RGCs was significantly correlated in Rx-β2cKO mice (red * - compared to randomized), but was not correlated above chance at longer distances between RGCs. Rx-β2cHet spiking activity was significantly correlated at most distances and was more highly correlated than Rx-β2cKO activity (black *) even at shorter distances. (C) The overall firing rate in Rx-β2cKO (red) mice was reduced to less than 30% of that observed in Rx-β2cHet (black) controls. The remaining spiking activity was mediated by nAChRs, as it was completely blocked by DHβE, a nAChR specific antagonist. (D) There were a similar number of spikes occurring within bursts in Rx-β2cKO (red) and Rx-β2cHet (black) mice. However, the number of bursts (E) and the average spikes in a burst (F) was significantly reduced in Rx-β2cKO mice (P<0.001, Student t-test). (G) Burst duration was comparable between Rx-β2cKO and Rx-β2cHet mice. Inter-electrode distance = 100 μm.
Figure 5
Figure 5. Disrupted eye-specific segregation in Rx-β2cKO mice
Eye-specific segregation was examined by anterograde labeling of RGC axonal projections to the dLGN and the SC by intraocular injection of CTB-488 and CTB-555 into the right and left eyes, respectively. (A) Representative fluorescence images of ipsilateral (top), contralateral (middle) and both contralateral (green) and ipsilateral RGC projections (red) together (bottom) in the dLGN of WT (Rx-Cre;β2flox/+), heterozygous (Rx-Cre+;β2flox/+ or Rx-Cre;β2flox/−), and Rx-β2cKO (Rx-Cre+;β2flox/−) mice at P8. (B) Summary quantification of the fraction of the ipsilateral, contralateral and overlap projections in the dLGN at P8. Axons of ipsilateral projections occupied a larger fraction of the dLGN and overlapped more with projections from the contralateral eye in Rx-β2cKO mice than in littermate WT and heterozygous controls. The segregation index for retinal projections to the dLGN in Rx-β2cKO mice was also significantly lower than that of WT and heterozygous controls at P8. (C) Representative projection patterns of RGCs from the two eyes in the SC of WT, heterozygous, and Rx-β2cKO mice. RGC axons from the contralateral eye arborize in the superficial layer of the SC (green in bottom) and axons from the ipsilateral eye project to the lower layer of the SC (top panel and red in bottom). There was very little overlap of projections from the two eyes in the SC in the WT and heterozygous controls. In Rx-β2cKO mice, the projections from the ipsilateral eye extended into the upper layer and overlapped with projections from the contralateral eye. (D). Summary quantification of ipsi projections in the SGS layer (top) and the fraction of overlaped projections (bottom) in the WT, heterozygous, and Rx-β2cKO mice. Scale = 500 μm.
Figure 6
Figure 6. Normal retinotopic refinement in the SC of Rx-β2cKO mice
Retinotopy was investigated by focal injections of a small amount (2.3nl) of fluorescence dye (DiI) into indicated regions of the retina, and the size of RGC axon target zones in the SC were quantified in WT, Heterozygous (Rx-β2cHet and β2Het) and Rx-β2cKO mice. (A) Examples of target zones of a small group of RGCs in the dorsal (top), ventral-temporal retina (middle) in WT, Rx-β2cKO and heterozygous mice. There was no difference in the target zone size of dorsal projections in the four groups of mice (top), whereas the target zone of the ventral-temporal projection was significantly enlarged in Rx-β2cKO mice (middle). (B) and (C) Summary quantification of target zone sizes (% of SC) of dorsal and ventral-temporal projections, respectively. (A-bottom) and (D) Examples and summary quantification of ventral-temporal projections following monocular ipsilateral eye enucleation. The target zone of ventral-temporal RGC projections to the SC in Rx-β2cKO mice was not significantly different from WT and heterozygous controls after ipsilateral eye enucleation. Scale = 500 μm.
Figure 7
Figure 7. Normal retinotopic refinement in the dLGN of Rx-β2cKO mice
Retinotopy in the dLGN was investigated by focal injections of a small amount (2.3nl) of fluorescence dye (DiI) into indicated regions of the retina and the size of RGC axon target zones in the dLGN was quantified in WT (Rx-Cre; β2flox/+) and Rx-β2cKO mice. (A) Examples of target zones of a small group of RGCs from the dorsal (top) and ventral-temporal (VT) retina (middle) in WT and Rx-β2cKO mice. There was no difference in the size of target zones for dorsal projections between these two groups of mice (top), whereas the target zone for the ventral-temporal projections was significantly enlarged in Rx-β2cKO mice (middle). Following ipsilateral eye enucleation (bottom), the ventral-temporal target zone in Rx-β2cKO was similar to WT mice. Scale = 500 μm. (B) Summary quantification of target zone sizes (% of dLGN volume) for dorsal projections and ventral-temporal (VT) projections with and without ipsilateral eye enucleation. VT projections in Rx-β2cKO mice were significantly enlarged compared to WT mice, but were no different following monocular enucleation.
Figure 8
Figure 8. Truncated spontaneous waves in β2(TG) mice
Spontaneous RGC waves were recorded in vivo in the SC. GCaMP6 was expressed in RGCs through viral transfection. (A) Example wave montages from a P5 β2(TG) mouse. Grayscale image on left (top) shows the craniotomy over SC. White arrowheads show onsets and arrows indicate wave fronts of two local propagating waves. Movie frames shown in montage at 1s interval. Waves of β2(TG) mice were smaller (B, P<0.01 for comparison between β2(TG) and β2 heterozygous controls) and briefer (C, P<0.05 for comparison between β2(TG) and β2 heterozygous controls). The frequency (E) of calcium events in each ROI were comparable between β2(TG) and β2 heterozygous controls, while event duration (F) was lower (P<0.001) and calcium signal amplitude trends lower (P=0.097) in β2(TG) mice. (G) and (H) Cumulative distribution and histogram curves of wave propagation speed, measured as coverage area per second in β2 heterozygotes, β2(TG) and Rx-β2cKOs. The distribution of wave propagation speed in β2(TG) mice was similar to that in β2 heterozygotes (Rx-β2cHets), but was significantly different from Rx-β2cKO (P<0.001). (I) Average wave propagation speed was higher in Rx-β2cKO than in β2(TG) and in Rx-β2cHet (P<0.01, 0.001). Scale = 400 μm.

Similar articles

Cited by

References

    1. Ackman JB, Burbridge TJ, Crair MC. Retinal waves coordinate patterned activity throughout the developing visual system. Nature. 2012;490:219–225. - PMC - PubMed
    1. Ackman JB, Crair MC. Role of emergent neural activity in visual map development. Curr Opin Neurobiol. 2014;24:166–175. - PMC - PubMed
    1. Bansal A, Singer JH, Hwang BJ, Xu W, Beaudet A, Feller MB. Mice lacking specific nicotinic acetylcholine receptor subunits exhibit dramatically altered spontaneous activity patterns and reveal a limited role for retinal waves in forming ON and OFF circuits in the inner retina. J. Neurosci. 2000;20:7672–81. - PMC - PubMed
    1. Blankenship AG, Feller MB. Mechanisms underlying spontaneous patterned activity in developing neural circuits. Nat Rev Neurosci. 2010;11:18–29. - PMC - PubMed
    1. Burbridge TJ, Xu HP, Ackman JB, Ge X, Zhang y., Ye MJ, Zhou ZJ, Xu J, Contractor A, Crair MC. Visual circuit development requires patterned activity mediated by retinal acetylcholine receptors. Neuron. 2014;84(5):1049–64. - PMC - PubMed

MeSH terms

LinkOut - more resources