. 2015 Mar 19:5:9258.
doi: 10.1038/srep09258.

Single cell visualization of transcription kinetics variance of highly mobile identical genes using 3D nanoimaging

Affiliations

Single cell visualization of transcription kinetics variance of highly mobile identical genes using 3D nanoimaging

Paolo Annibale et al. Sci Rep. .

Abstract

Multi-cell biochemical assays and single cell fluorescence measurements revealed that the elongation rate of Polymerase II (PolII) in eukaryotes varies largely across different cell types and genes. However, there is not yet a consensus whether intrinsic factors such as the position, local mobility or the engagement by an active molecular mechanism of a genetic locus could be the determinants of the observed heterogeneity. Here by employing high-speed 3D fluorescence nanoimaging techniques we resolve and track at the single cell level multiple, distinct regions of mRNA synthesis within the model system of a large transgene array. We demonstrate that these regions are active transcription sites that release mRNA molecules in the nucleoplasm. Using fluctuation spectroscopy and the phasor analysis approach we were able to extract the local PolII elongation rate at each site as a function of time. We measured a four-fold variation in the average elongation between identical copies of the same gene measured simultaneously within the same cell, demonstrating a correlation between local transcription kinetics and the movement of the transcription site. Together these observations demonstrate that local factors, such as chromatin local mobility and the microenvironment of the transcription site, are an important source of transcription kinetics variability.


Figures
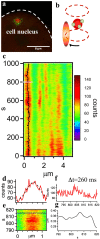
Figure 1
Figure 1. Imaging mRNA synthesis distinct regions of an activated transgene array at high spatio-temporal resolution.
(a) Multicolor Laser Scanning micrograph of the chromatin array (LacI-mCherry: red) and the mRNA (MS2-EGFP: green) in U2OS 263 cells following Dox induction (+30′). Excitation is provided with 561 nm and 488 nm lasers. Petals of mRNA synthesis are clearly visible. (b) Schematics of the experimental configuration for 3D orbital tracking using a 2-photon laser-scanning microscope. The difference in the fluorescence intensity collected from a circular orbit above and a circular orbit below the particle determines its axial coordinate (z-position). The intensity profile along each circular orbit is used to find the x and y position of the fluorescence center of mass in the imaging plane, using a Fast Fourier Transform based localization algorithm. The particle can be followed using a feedback loop that re-centers the orbit on the particles at each cycle. One orbit is performed every 32 ms and a full 3D localization cycle happens within eight orbits. (c) Kymograph of the fluorescence intensity collected along the entire orbit, reflecting the presence of five globular regions or petals. Each line is calculated integrating the fluorescence intensity of 16 orbits, yielding a temporal resolution of 260 ms. The black line highlights the angular trajectory of one of the petals. (d and e) Detail of a 30 s interval of the fluorescence kymograph, and Gaussian fit of the line intensity profile. The center of the petal is localized with a precision <6 nm. (f) Intensity profile measured from the carpet displayed in e (g) Sub μm displacement trajectory of the petal.
Figure 2
Figure 2. pCF analysis of mRNA molecules leaving the petals and flowing into the nucleoplasm.
(a) Schematics of the laser trajectory around the transgene array. The laser PSF performs a trefoil orbit and the lobes of the trefoil reach into the nucleoplasm about 1 μm away from the center of the array. A distance of 12 pixels along the rows of the carpet is used to calculate the pCF carpet. The fluorescence collected at each point along the orbit is cross-correlated to that recovered at a point 12 pixels away (a variable distance given the shape of the orbit). The result of the cross-correlation at each instant of time is the Pair Correlation Function (pCF). (b) The pCF calculated for each point of the orbit can be used to calculate the pair correlation carpet (pC carpet). Each column of the pC carpet indicates the degree of connection (due to diffusion or flow of fluorescently labeled mRNA) between two positions spaced at 12 pixels along the orbit. Intensity at short times in the 1 to 2 column indicated diffusion of mRNA molecules from the petals, rather than from the center of the array (no cross-correlation in the 3 to 5 column). The pCF 4 to 6 highlights a delay for the mRNA to reach the nucleoplasm from this petal. The mRNAs diffuse freely in the nucleoplasm, as indicated by the 5 to 7 column, but cannot reach the center of the dense chromatin array (no cross-correlation is observed in the transition 8 to 9). The amount of delay for the mRNA in reaching the nucleoplasm is again different when looking at the last petal (10 to 11). The pC carpet was smoothed to reduce noise. (c) Schematic representation of the pCF at the positions where newly synthesized mRNAs leave the petals. Delays of up to a few seconds in reaching the lobes of the orbit can be observed.
Figure 3
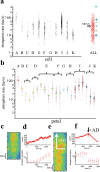
Figure 3. Measuring heterogeneous PolII elongation kinetics across cells, within cells and within petals.
(a) PolII elongation rates measured using the Phasor Method in different interphase cells. Letters A-K identify 11 different U2OS 263 cells containing the transgene array. The scatter plot for each cell is obtained by combining the elongation measurements on multiple petals. The distribution of elongation rates integrated for all the cells is labeled as ALL. Symbols indicate previous measurements of PolII elongation using the MS2 system: Diamond Maiuri et al; Cross Darzacq et al; Dot Hocine et al; Star Boireau et al; Circle-dot Larson et al; Square Yunger et al. Blue: mammalian cell lines. Green: yeast. (b) Scatter plot of PolII elongation rates measured in the petals inside the cells reported in panel a. Mean Values and Standard Error of the Mean are superimposed. (c) Fluorescence kymograph of a petal observed to display increasing MS2-EGFP intensity over a period of approximately 35 minutes after Dox induction, indicative of activation. (d) (top) Intensity counts for the kymograph in c and (bottom) corresponding elongation rates as a function of time. (e) Intensity carpet of a petal upon treatment with 10 μg/ml AD. (f) (top) Intensity counts for the kymograph in (e) and (bottom) corresponding elongation rates as a function of time.
Figure 4
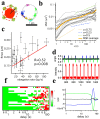
Figure 4. Correlation between mRNA transcription kinetics and petal mobility.
(a) The petals display sizable motion along the surface of the transgene array (left). Localized positions (using the Particle Tracker Mosaic ImageJ Plugin) of the petals over time reveal that this motion is predominantly angular (indicated as ϕ in the figure). (b) MSD analysis of the angular (ϕ) displacement of the petals. Black dashed lines: experimental MSD of the petals. Orange line: average of experimental MSD. Guide for the eye: MSD∝t0.75 for time scales <5–10 s (dotted orange line) and MSD∝t0.25–0.5 (dashed-dotted blue and green lines) between 10–100 s. (c) Scatter plot of the confinement radius Rmax (calculated extrapolating the 10–100 s MSD power law fits to 512 s) against the elongation rate measured for each petal. Superposed is a linear regression. Pearson correlation coefficient is R = +0.52 with a p-value = 0.008. (d) Simulated trace of intensity fluctuations (bottom) and angular (ϕ) displacement (top) of a petal for counterclockwise (blue trace), clockwise (green trace) and bidirectional (black trace) motion. (e) Calculated cross-correlation for each of the three cases. A peak in the cross-correlation function is present only if there is a predominant directional motion. (f) Binary map of cross-correlation of the fluorescence intensity and the angular (ϕ) displacement of the petals, calculated in 128 s time bins. Each line corresponds to a different experiment, and the sign of the cross-correlation amplitude is arranged in order to display negative values first. The average cross-correlation function measured for each petal is displayed (±1) only if above the 99% confidence band for pure diffusion.
Figure 5
Figure 5. Model of transcription and mRNA export from multimer copies of the same locus within a transgene array.
Transcription is observed to occur only on the surface of the transgene array, in distinct and mobile structures named petals. Each petal undergoes different transcription kinetics (elongation rates k1, k2) and releases mRNA molecules in the nucleoplasm with characteristic times. The most mobile petals display higher elongation kinetics and each petal moves along a preferential direction as the amount of labeled mRNA increases, and recoils after a 10–100 s delay.

References

    1. Ardehali M. B. & Lis J. T. Tracking rates of transcription and splicing in vivo. Nature structural & molecular biology 16, 1123–1124 (2009). - PubMed
    1. Raj A., Peskin C. S., Tranchina D., Vargas D. Y. & Tyagi S. Stochastic mRNA synthesis in mammalian cells. PLoS Biol 4, e309 (2006). - PMC - PubMed
    1. Vinuelas J. et al. Quantifying the contribution of chromatin dynamics to stochastic gene expression reveals long, locus-dependent periods between transcriptional bursts. BMC Biol 11, 15 (2013). - PMC - PubMed
    1. Danko C. G. et al. Signaling pathways differentially affect RNA polymerase II initiation, pausing, and elongation rate in cells. Molecular cell 50, 212–222 (2013). - PMC - PubMed
    1. Hocine S., Raymond P., Zenklusen D., Chao J. A. & Singer R. H. Single-molecule analysis of gene expression using two-color RNA labeling in live yeast. Nature methods 10, 119–121 (2013). - PMC - PubMed

Publication types