. 2015 Mar 30;6(9):6570-83.
doi: 10.18632/oncotarget.3262.

Pyruvate kinase M2 prevents apoptosis via modulating Bim stability and associates with poor outcome in hepatocellular carcinoma

Affiliations

Pyruvate kinase M2 prevents apoptosis via modulating Bim stability and associates with poor outcome in hepatocellular carcinoma

Wen Hu et al. Oncotarget. .

Abstract

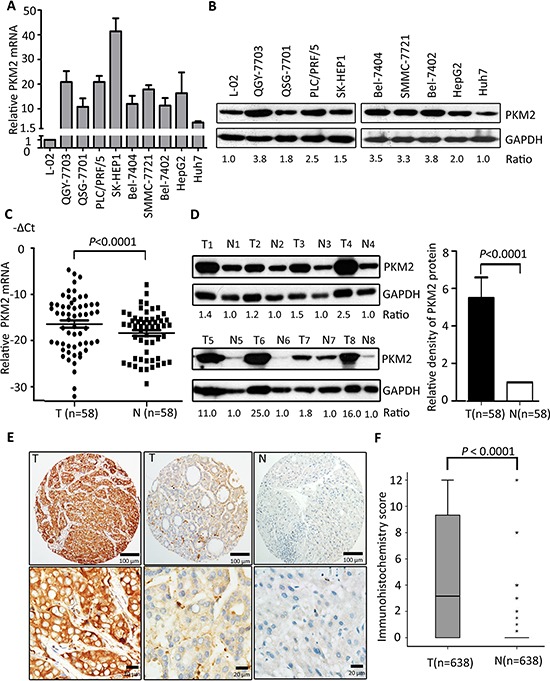
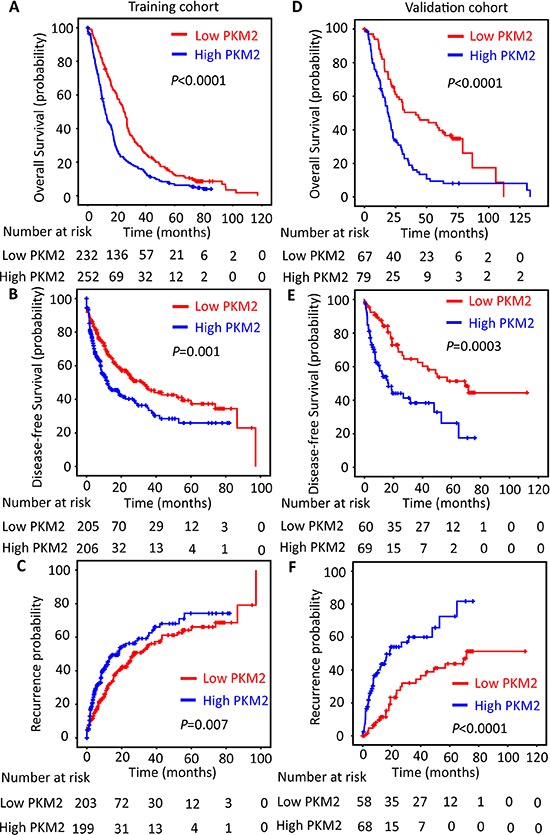
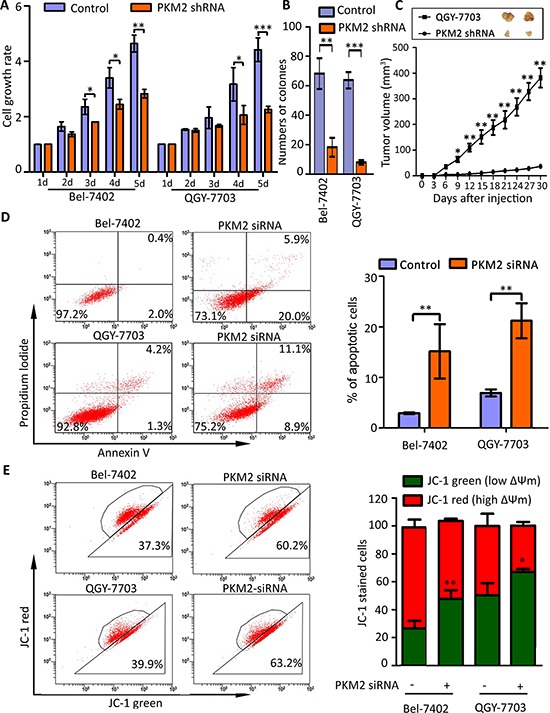
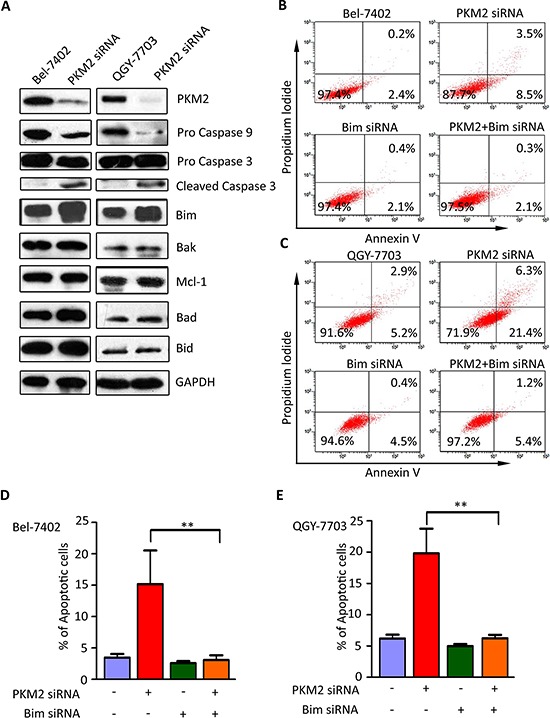
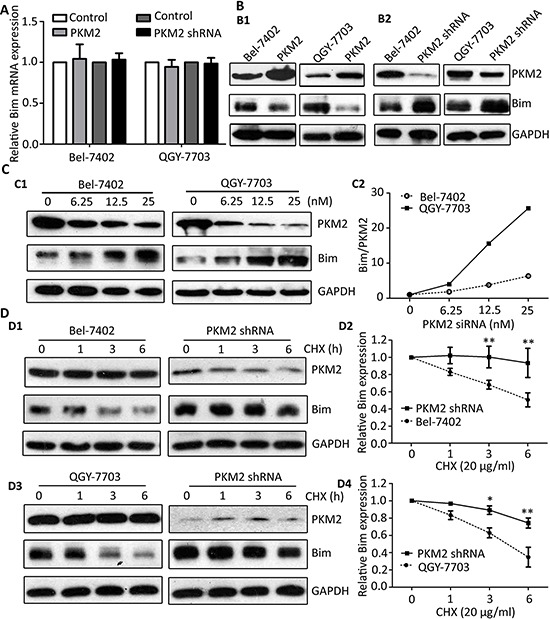
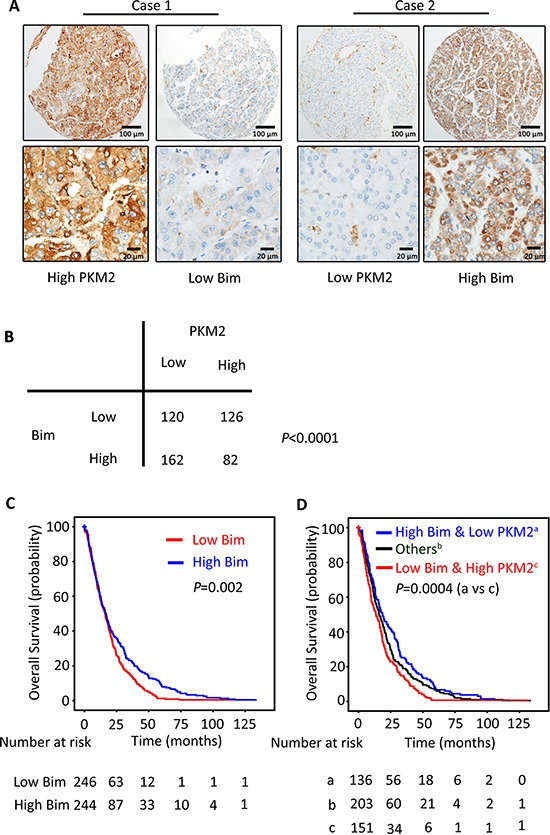
Pyruvate kinase M2 (PKM2) contributes to the Warburg effect, a hallmark of cancer. We showed that PKM2 levels were correlated with overall survival (hazard ration = 1.675, 95% confidence interval: 1.389-2.019, P < 0.001) and disease-free survival (hazard ration = 1.573, 95% confidence interval: 1.214-2.038, P < 0.001) in a cohort of 490 patients with HCC. The correlations were further validated in an independent cohort of 148 HCC patients. Multivariate analyses revealed that PKM2 was an independent indicator of poor outcome in HCC. The knockdown of PKM2 in HCC cells inhibited cell proliferation and induced apoptosis in vitro and in vivo. Bim siRNA markedly abolished the PKM2-depletion-induced apoptosis. PKM2 depletion decreased the degradation of Bim. In clinical samples, PKM2 expression was reversely correlated with Bim expression. Combination of PKM2 and Bim levels had the best prognostic significance. We suggest that PKM2 serves as a promising biomarker for poor prognosis of patients with HCC and its knockdown induces HCC apoptosis by stabilizing Bim.

Keywords: Bim; PKM2; apoptosis; hepatocellular carcinoma.


Conflict of interest statement

CONFLICTS OF INTEREST

No potential conflicts of interest were disclosed.

Figures

Figure 1
Figure 1. PKM2 is overexpressed in HCC cell lines and tissues
(A) Expression of PKM2 mRNA was detected in 9 HCC cell lines by qRT-PCR. Immortalized liver cell line L-02 was used as control. (B) The relevant expression of PKM2 in HCC cell lines was examined by western blot. (C) PKM2 mRNA level was determined in 58 pairs of fresh primary HCC tissues (P < 0.0001, Wilcoxon matched-paired test) (T, tumorous tissue; N, nontumorous tissue). (D) The expression level of PKM2 protein in 58-paired samples was also examined by western blot. Representative results and the ratio of T/N were shown. Increased expression of PKM2 protein in tumorous tissues was indicated by histogram (P < 0.0001, Wilcoxon matched-paired test). (E) PKM2 expression in 638 HCC tissues was determined by IHC. Representative images of strong/weak staining in HCC tissue and negative staining in the nontumorous tissue were shown. (F) The box plot showed the IHC score of PKM2 in 638 HCC cases. Data are mean ± SEM (**P < 0.0001, Wilcoxon matched-paired test).
Figure 2
Figure 2. PKM2 expression is reversely correlated with outcomes of HCC patients
The HCC patients in the training (n = 490) and validation (n = 148) cohort were stratified according to the expression of PKM2. Kaplan–Meier analysis disclosed the relationship of PKM2 expression and the overall survival (A&D), disease-free survival (B&E) and recurrence probability (C&F) of HCC patients (log-rank test).
Figure 3
Figure 3. PKM2 knockdown inhibits cell proliferation and induces apoptosis
(A) PKM2 knockdown impaired cell viability. Cells stably transfected with PKM2 shRNA or scrambled shRNA were cultured in 96-well plate for 5 d. Cell viability was measured by MTT Assays. (B) PKM2 depletion weakened monoclonal formation ability of HCC cells. Number of colonies was shown. (C) PKM2 knockdown inhibited tumor growth in vivo. Stable cell lines were subcutaneous injected into the right flank of null mice. Tumors were sectioned at day 28. The tumor volumes were recorded every three days. (D) PKM2 silence induced apoptosis in HCC cells. Cells were transfected with negative or PKM2 siRNA for 48 hours, and then stained with Annexin V and Propidium Iodide (PI) (left panel). Percentage of apoptotic cells were recorded (right panel). (E) PKM2 siRNA induced the decrease of mitochondrial membrane potential. Cells were transfected with PKM2 siRNA for 48 h and stained with JC-1 for 15 min. The mitochondrial transmembrane potential (ßψm) was determined by FACS (left panel). Graph depicts mean ± SEM of three independent experiments (right panel). All *P < 0.05, **P < 0.01, ***P < 0.001.
Figure 4
Figure 4. Bim is essential for PKM2–depletion-induced apoptosis
(A) Silence of PKM2 led to increase of Bim expression and activation of Caspase 9. HCC cells were transfected with PKM2 or negative control siRNA for 48 h. Expressions of Caspase 3, Caspase 9 as well as Bcl-2 family proteins, including Bid, Bim, Mcl-1, Bad and Bak, were examined by western blot. GAPDH was used as loading control. (B–E) Bim siRNA attenuated apoptosis caused by PKM2 siRNA. PKM2 and Bim siRNA were co-transfected into QGY-7703 and Bel-7402 cells for 48 h. Apoptosis was determined by flow cytometry. All **P < 0.01, paired student t-test.
Figure 5
Figure 5. PKM2 knockdown attenuates the degradation of Bim
(A) PKM2 did not affect the mRNA level of Bim. Bim mRNA expression in cells with PKM2 overexpression or knockdown was determined by qRT-PCR. (B) PKM2 regulated the expression of Bim protein. Level of Bim protein was examined in cells transfected with PKM2 (B1) and PKM2 shRNA (B2). (C) PKM2 silence increased Bim expression in a dose-dependent manner. Cells were treated with various concentration of PKM2 siRNA for 48 h, and the expressions of PKM2 and Bim were determined (left panel). The relative Bim/PKM2 ratio was calculated (right panel). (D) PKM2 contributed to the stability of Bim protein. Stable cells with PKM2 knockdown were treated with 20 ug/ml CHX for indicated times. The expression of Bim was detected (D1 and D3). The decrease of Bim protein was normalized and shown (D2 and D4). GAPDH was used as loading control. At least three experiments were performed. Data are mean ± SEM (*P < 0.05, **P < 0.01).
Figure 6
Figure 6. PKM2 expression is reversely correlated with Bim expression in clinical samples
(A) The relationship of PKM2 and Bim in 490 patients with HCC was determined by IHC. Representative immunohistochemical images of PKM2 and Bim were shown. (B) Spearman correlation analysis showed the relationship of PKM2 and Bim expression. The p value was generated using χ2 test. (C) The prognostic value of Bim was determined by Kaplan–Meier analysis. (D) HCC cases were divided into 3 groups according to the combination of PKM2 and Bim expression. Kaplan–Meier analysis was conducted to estimate of overall survival of the patients in the 3 groups.

References

    1. Koppenol WH, Bounds PL, Dang CV. Otto Warburg's contributions to current concepts of cancer metabolism. Nat Rev Cancer. 2011;11:325–337. - PubMed
    1. Luo W, Semenza GL. Pyruvate kinase M2 regulates glucose metabolism by functioning as a coactivator for hypoxia-inducible factor 1 in cancer cells. Oncotarget. 2011;2:551–556. - PMC - PubMed
    1. Yang W, Lu Z. Regulation and function of pyruvate kinase M2 in cancer. Cancer Lett. 2013;339:153–158. - PMC - PubMed
    1. Yang W, Xia Y, Ji H, Zheng Y, Liang J, Huang W, Gao X, Aldape K, Lu Z. Nuclear PKM2 regulates beta-catenin transactivation upon EGFR activation. Nature. 2011;480:118–122. - PMC - PubMed
    1. Yuan C, Li Z, Wang Y, Qi B, Zhang W, Ye J, Wu H, Jiang H, Song LN, Yang J, Cheng J. Overexpression of metabolic markers PKM2 and LDH5 correlates with aggressive clinicopathological features and adverse patient prognosis in tongue cancer. Histopathology. 2014;65:595–605. - PubMed

Publication types

MeSH terms