. 2015 Nov;26(11):2647-58.
doi: 10.1681/ASN.2014080741. Epub 2015 Mar 18.

A Role for Tubular Necroptosis in Cisplatin-Induced AKI

Affiliations

A Role for Tubular Necroptosis in Cisplatin-Induced AKI

Yanfang Xu et al. J Am Soc Nephrol. 2015 Nov.

Abstract

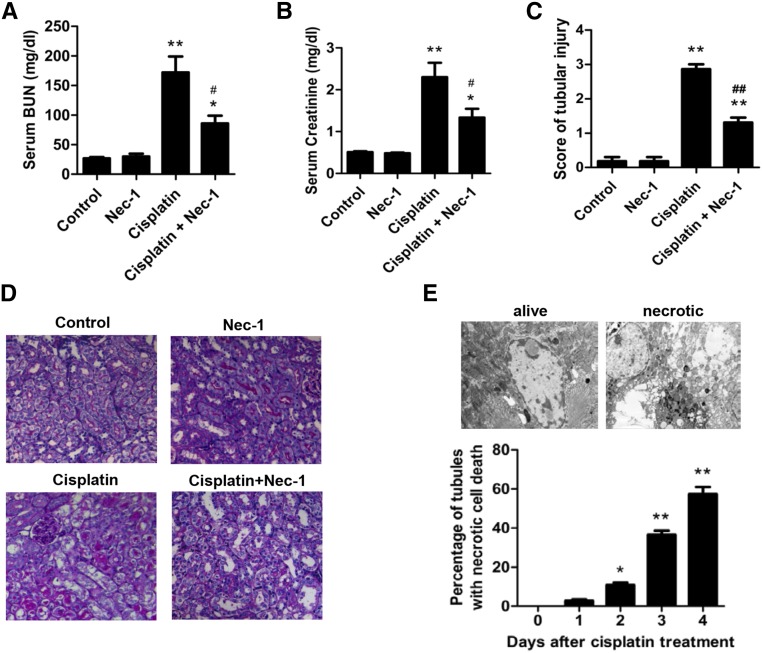
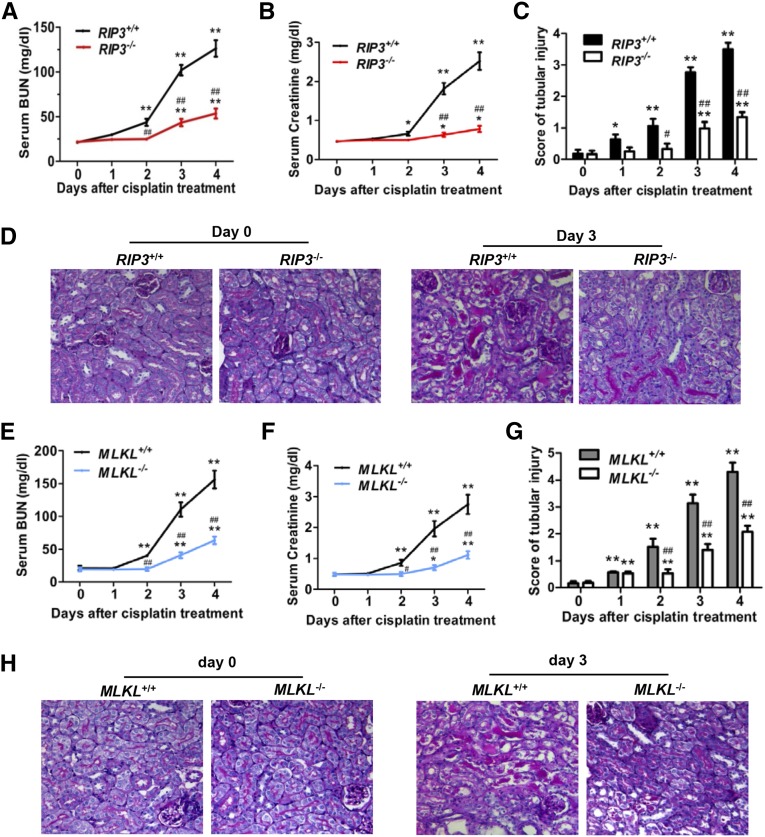
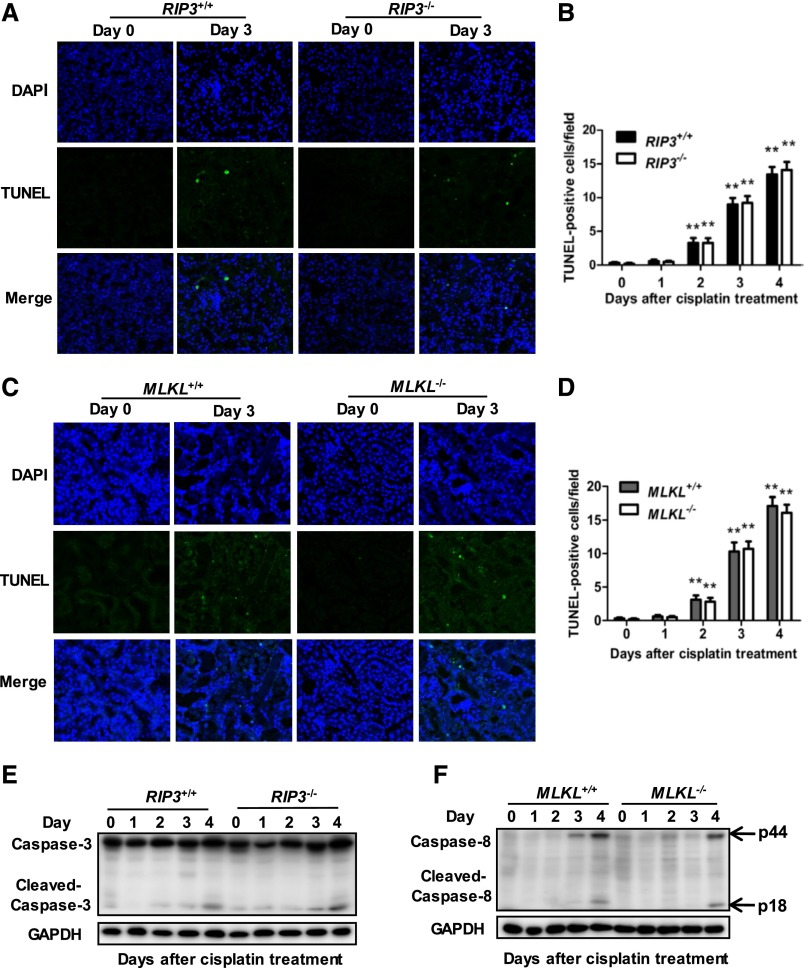
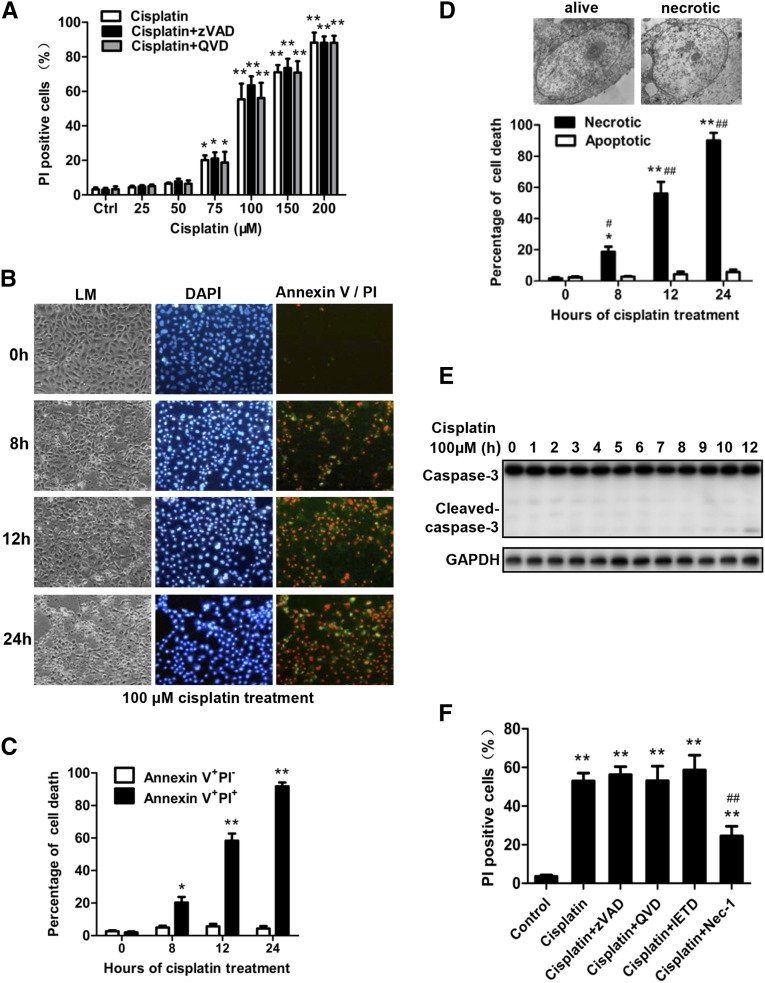
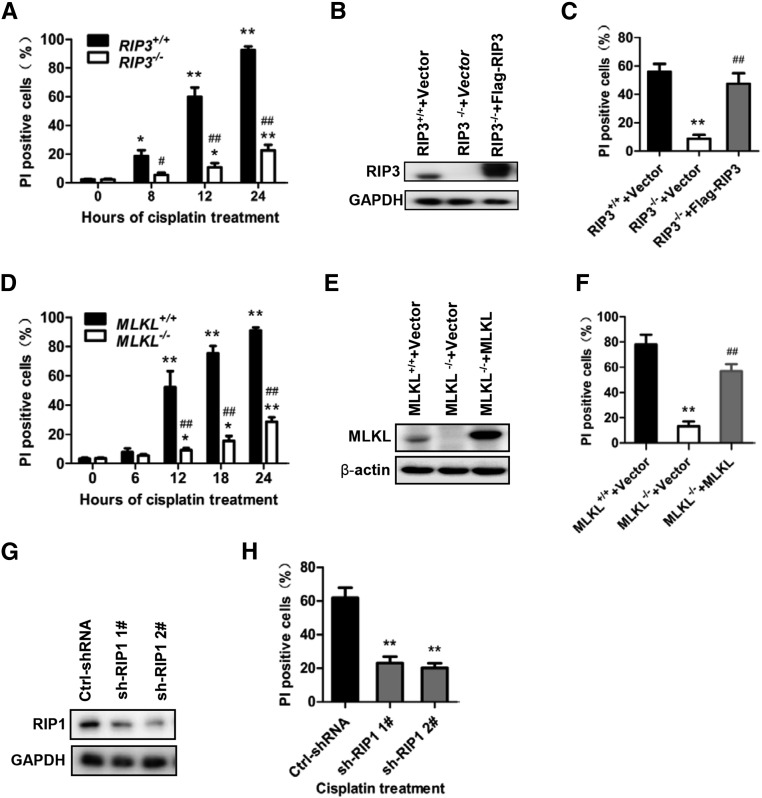
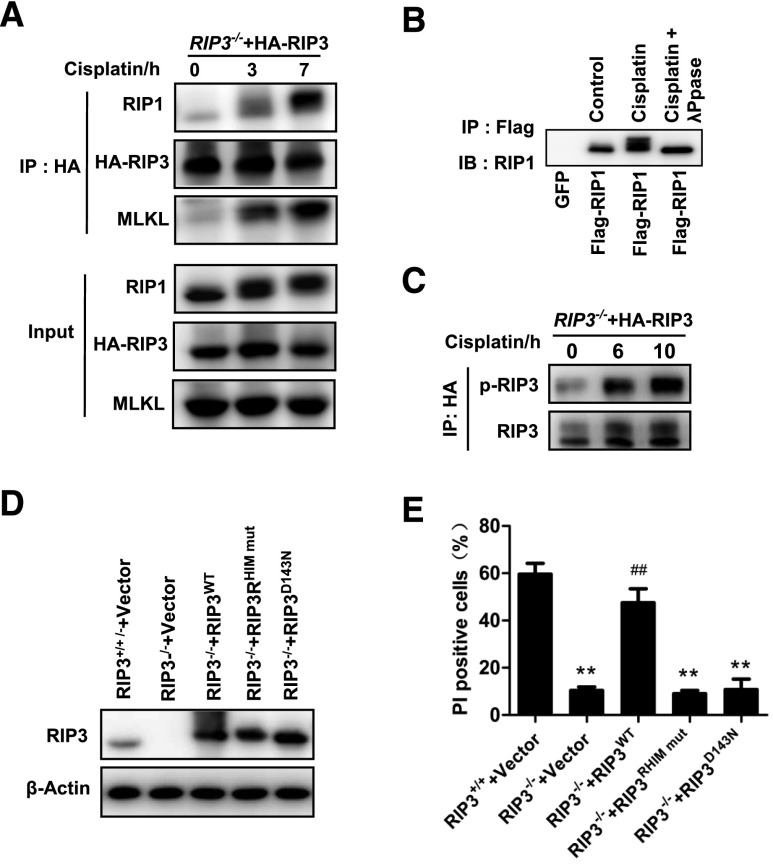
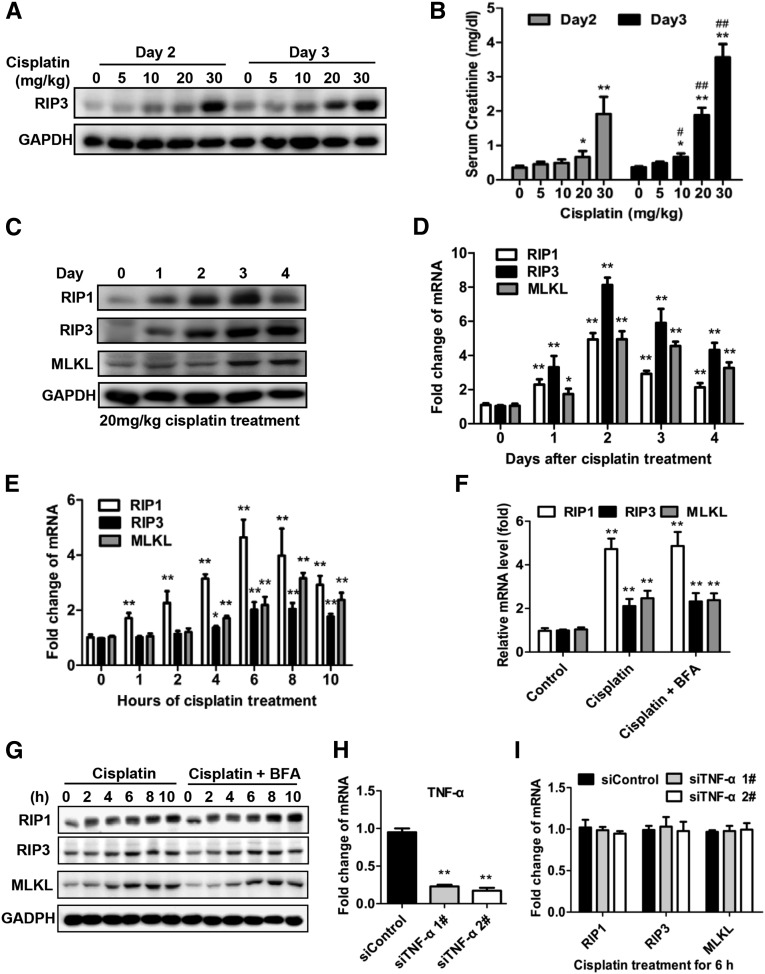
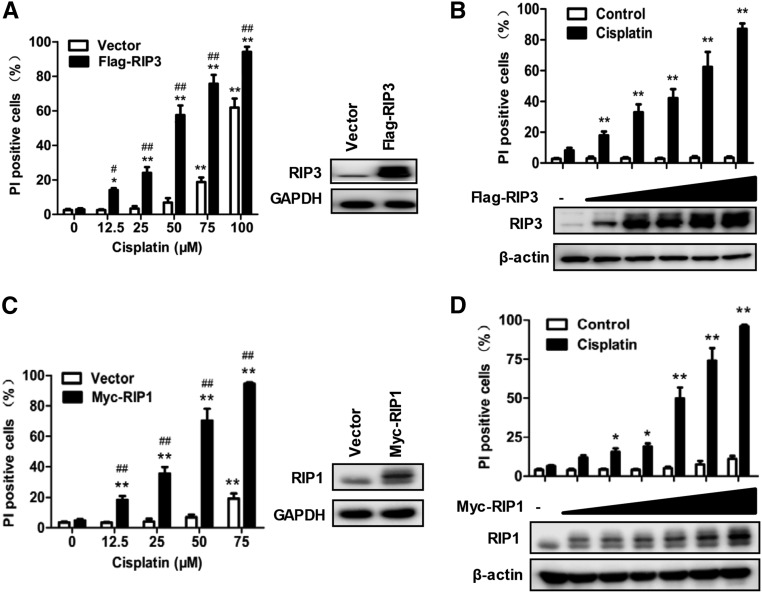
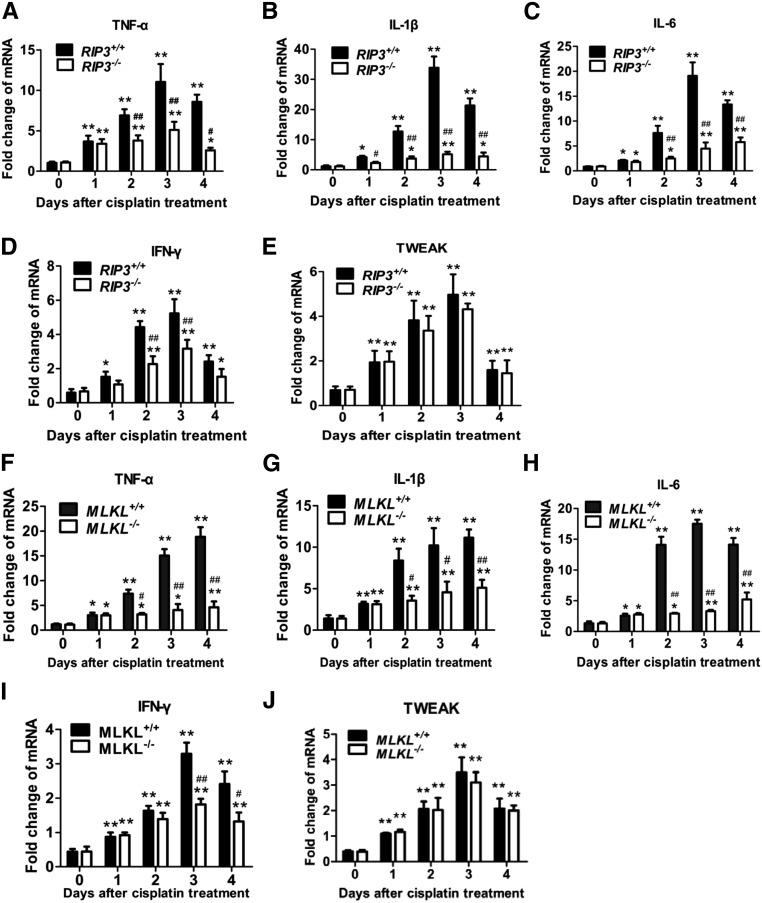
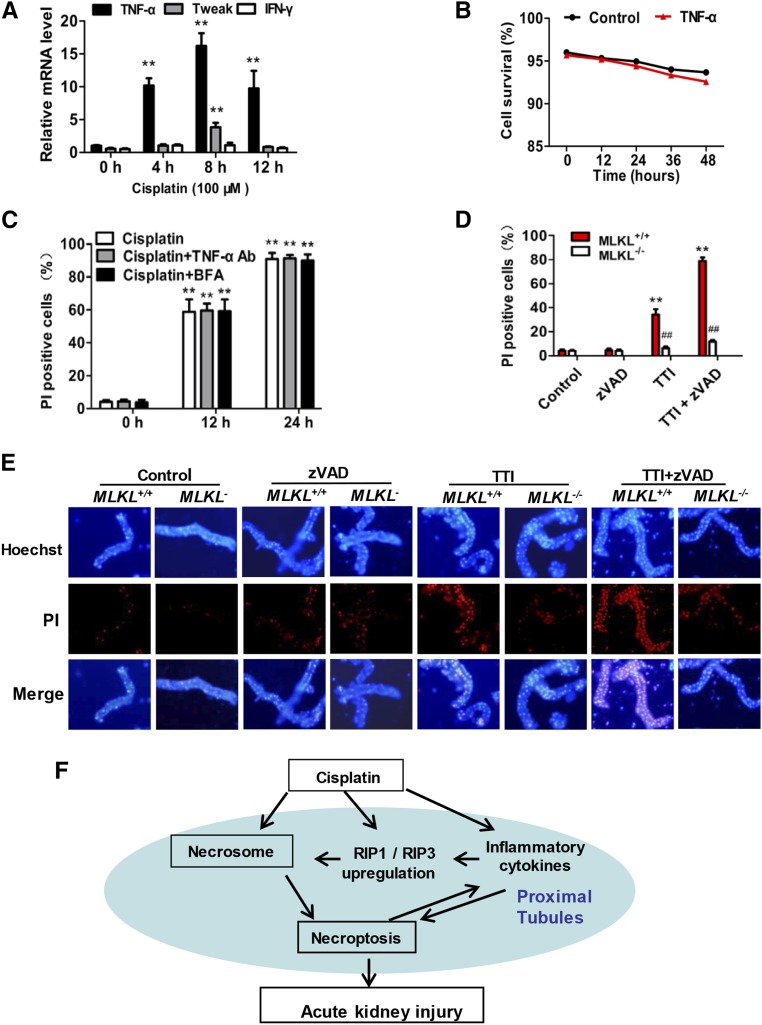
Cell death and inflammation in the proximal tubules are the hallmarks of cisplatin-induced AKI, but the mechanisms underlying these effects have not been fully elucidated. Here, we investigated whether necroptosis, a type of programmed necrosis, has a role in cisplatin-induced AKI. We found that inhibition of any of the core components of the necroptotic pathway-receptor-interacting protein 1 (RIP1), RIP3, or mixed lineage kinase domain-like protein (MLKL)-by gene knockout or a chemical inhibitor diminished cisplatin-induced proximal tubule damage in mice. Similar results were obtained in cultured proximal tubular cells. Furthermore, necroptosis of cultured cells could be induced by cisplatin or by a combination of cytokines (TNF-α, TNF-related weak inducer of apoptosis, and IFN-γ) that were upregulated in proximal tubules of cisplatin-treated mice. However, cisplatin induced an increase in RIP1 and RIP3 expression in cultured tubular cells in the absence of cytokine release. Correspondingly, overexpression of RIP1 or RIP3 enhanced cisplatin-induced necroptosis in vitro. Notably, inflammatory cytokine upregulation in cisplatin-treated mice was partially diminished in RIP3- or MLKL-deficient mice, suggesting a positive feedback loop involving these genes and inflammatory cytokines that promotes necroptosis progression. Thus, our data demonstrate that necroptosis is a major mechanism of proximal tubular cell death in cisplatin-induced nephrotoxic AKI.

Keywords: cisplatin nephrotoxicity; necroptosis; renal proximal tubule cell.


Figures

Figure 1.
Figure 1.
Necroptosis contributes to cisplatin-induced nephrotoxity. (A–E) Male C57BL/6 mice underwent intraperitoneal injection with vehicle or 20 mg/kg cisplatin (n=8). All mice received 250 µl total volume of PBS with DMSO or 1.65 mg/kg Nec-1 every 24 hours. (A and B) Blood samples were collected at day 3 after cisplatin injection to measure BUN and serum creatinine. (C) Histologic damage in the cortex and PAS-stained kidney sections (n=8) was scored by counting the percentage of tubules that displayed tubular necrosis, cast formation, and tubular dilation as follows: 0=normal; 1=<10%; 2=10%–25%; 3=26%–50%; 4=51%–75%; 5=>75%. Ten randomly selected fields (original magnification, ×200) per kidney were used for counting. *P<0.05 and **P<0.01 versus control group; #P<0.05 and ##P<0.01 versus cisplatin group. (D) Representative images of PAS-stained kidney sections (×200). (E) Representative electron micrographs of proximal renal tubule cells showing that the necrotic cells had nuclear swelling and loss of cell organelle content (original magnification, ×5000) are shown (upper panel). The percentage of proximal tubules containing necrotic cells was evaluated in 30 grid fields (0.236 mm2 per section). Five sections per kidney were used for counting (n=6). Quantifications of proximal tubule percentages with necrotic tubular cells are shown (lower panel). *P<0.05 and **P<0.01 compared with day 0.
Figure 2.
Figure 2.
Cisplatin-induced AKI is attenuated in RIP3-KO and MLKL-KO mice. (A–H) The kidneys and blood samples in mice were harvested at 0, 1, 2, 3, or 4 days after treatment with 20 mg/kg cisplatin (n=8). (A, B, E, F) Serum samples were collected for measurements of BUN and serum creatinine levels. (C and G) Histologic damage in the cortex and PAS-stained kidney sections (n=8) was scored by the same evaluation method as shown in Figure 1. *P<0.05 and **P<0.01 versus day 0; #P<0.05 and ##P<0.01 versus WT. (D and H) Representative images of PAS-stained kidney sections are shown. Original magnification, ×200.
Figure 3.
Figure 3.
RIP3 or MLKL deficiency dose not affect apoptosis in the proximal tubules of kidneys following cisplatin treatment. (A and C) Apoptosis in kidney cortical tissues was examined in TUNEL assays. Representative images of TUNEL staining are shown. Original magnification, ×200. (B and D) TUNEL-positive cells were counted in 10 randomly selected fields (original magnification, ×200) per kidney (n=8 in each group). **P<0.01 versus day 0. (E) Representative Western blot image of cleaved caspase-3 is shown. Glyceraldehyde 3-phosphate dehydrogenase serves as a loading control (n=4). (F) Representative Western blot image of cleaved caspase-8 is shown (n=4).
Figure 4.
Figure 4.
Detection of cisplatin-induced necroptosis in cultured primary PTCs. (A) PTCs from C57BL/6 mice were treated for 12 hours with vehicle control, different dose of cisplatin as indicated or cisplatin plus QVD (20 µM) or zVAD (20 µM). PI-positive cells were determined and shown (n=4 in each group). *P<0.05 and **P<0.01 versus control group. (B) PTCs were treated with 100 µM cisplatin for the indicated time period. Representative contrast phase light microscopic (LM), PI, and annexin V double-stained photographs are shown (original magnification, ×100). Hoechst was used to stain the nuclei (n=4). (C) The percentage of annexin V+ PI and annexin V+PI+ cells are shown (n=4). *P<0.05 and **P<0.01 versus 0 hours. (D) Representative electron micrographs of live and necrotic PTCs are shown (upper panel). The percentage of necrotic or apoptotic cells among the 200 PTCs counted for each sample is shown (lower panel) (n=4). *P<0.05 and **P<0.01 versus 0 hours. (E) Representative Western blot image of cleaved caspase-3 is shown. Glyceraldehyde 3-phosphate dehydrogenase was used as a loading control. (F) PTCs were treated with 100 µM cisplatin in the presence or absence of 20 µM zVAD, 20 µM QVD, 20 µM IETD (caspase-8 inhibitor), or 30 µM Nec-1 for 12 hours. PI-positive cells were determined and shown (n=4). *P<0.05 and **P<0.01 versus control group; ##P<0.01 versus cisplatin group.
Figure 5.
Figure 5.
Cisplatin-induced necroptosis is RIP1, RIP3, and MLKL dependent. (A) PTCs were isolated from RIP3+/+ and RIP3−/− mice and cultured for use in experiments. Cells were treated with 100 µM cisplatin for the time indicated. The percentage of PI-positive cell at each time-point is shown (n=6). *P<0.05 and **P<0.01 versus 0 hours; #P<0.05 and ##P<0.01 versus RIP3+/+ group. (B and C) Cells were infected with a lentivirus encoding nothing (vector) or Flag-RIP3 for 36 hours before stimulation with 100 µM cisplatin for 12 hours. RIP3 expression was analyzed by Western blot at 36 hours after infection (B). The percentage of PI-positive PTCs is shown in C (n=4). **P<0.01 versus RIP3+/+ group; ##P<0.01 versus RIP3−/− group. (D) Cells from the MLKL+/+ and MLKL−/− mice were treated with 100 µM cisplatin for indicated time course (n=6). *P<0.05 and **P<0.01 versus 0 hours; #P<0.05 and ##P<0.01 versus MLKL+/+ group. (E and F) Cells were infected with a lentivirus encoding nothing (vector) or MLKL for 36 hours before stimulation with or without 100 µM cisplatin for 18 hours. MLKL expression is shown in E. Quantification of PI-positive cells is shown in F. **P<0.01 versus MLKL+/+ group; ##P<0.01 versus MLKL−/− group (n=4). (G and H) PTCs were isolated from C57BL/6 mice and cultured for experiments (n=4). Cells were infected with a lentiviral vector encoding control or RIP1-shRNAs for 48 hours before stimulation with 100 µM cisplatin for 12 hours. RIP1 expression is shown in G. Quantification of PI-positive cells is shown in hours. **P<0.01 versus control group.
Figure 6.
Figure 6.
The formation of necrosomes containing RIP1, RIP3, and MLKL is required for cisplatin-induced cell necroptosis in PTCs. (A) PTCs from RIP3−/− mice were infected with HA-RIP3–expressing lentivirus before stimulation with 100 µM cisplatin for the indicated time (n=3). Cell lysates were immunoprecipitated with anti-HA antibody (IP: HA) and analyzed by immunoblotting with anti-RIP1, anti-RIP3, or anti-MLKL antibodies. Input, 5% of extract before immunoprecipitation (control). (B) PTCs were infected with a lentivirus encoding green fluorescent protein or Flag-RIP1 before stimulation with 100 µM cisplatin for 4 hours (n=3). Immunoprecipitations were performed using M2 beads. The immunoprecipitates were treated with or without λ-phosphatase, and then analyzed by immunoblotting with anti-RIP1 antibody. (C) PTCs from RIP3−/− mice were infected with HA-RIP3–expressing lentivirus and then stimulated with 100 µM cisplatin for the indicated time period (n=3). Cell lysates were immunoprecipitated with anti-HA antibody (IP: HA) and analyzed by immunoblotting with anti-RIP3 or anti–P-RIP3 antibodies. (D and E) Cells from RIP3−/− mice were infected with a lentivirus encoding nothing (vector) or Flag-RIP3wt, Flag-RIP3RHIM mut, or Flag-RIP3D143N for 36 hours. Cells from RIP3+/+ mice were infected with empty vector. RIP3 expression levels are shown in D by Western blot. All cells were stimulated with 100 µM cisplatin for 12 hours before quantification of PI-positive cells and shown in E (n=4). **P<0.01 versus RIP3+/++vector group; ##P<0.01 versus RIP3−/−+vector group.
Figure 7.
Figure 7.
RIP1 and RIP3 expression are increased in renal proximal tubules after cisplatin treatment. (A and B) Male C57BL/6 mice underwent intraperitoneal treatment with vehicle or 5–30 mg/kg cisplatin (n=8). Relative expression levels of RIP3 protein in freshly isolated proximal tubules were measured by Western blot (A). Blood samples were collected at day 2 and day 3 after cisplatin injection to measure serum creatinine (B). *P<0.05 and **P<0.01 versus 0 dose group. #P<0.05 and ##P<0.01 versus day 2 group. (C and D) Male C57BL/6 mice underwent intraperitoneal treatment with vehicle or 20 mg/kg cisplatin (n=8). Freshly isolated proximal tubules were collected for Western blot (C) and real-time PCR (D) analyses of RIP1, RIP3, and MLKL. *P<0.05 and **P<0.01 versus day 0 group. (E–I) PTCs were isolated from C57BL/6 mice and cultured for use in experiments. Cells were treated with 100 µM cisplatin for different time periods (E) or for 6 hours in the presence or absence of 10 µM Brefeldin A and then harvested for real-time PCR (F) and Western blot analyses (G) (n=4). *P<0.05 and **P<0.01 versus control group. (H–I) Effects of TNF-α–specific siRNA on RIP1, RIP3, and MLKL mRNA expression in PTCs treated with cisplatin for 6 hours (n=4). Gene expression levels were normalized to the expression of siControl group in the real-time PCR analysis. **P<0.01 versus siControl group.
Figure 8.
Figure 8.
Increased RIP1 or RIP3 expression in PTCs enhances their susceptibility to cisplatin-induced necroptosis. (A) PTCs from male C57BL/6 mice were infected with or without Flag-RIP3–expressing lentivirus for 36 hours and then treated with different does of cisplatin for 12 hours. The PI-positive cells (left panel) and the RIP3 levels (right panel) are shown (n=4). (B) PTCs were infected with different doses of Flag-RIP3–expressing lentivirus for 36 hours and then treated with 50 µM cisplatin for 12 hours. The PI-positive cells (top panel) and the RIP3 levels (bottom panel) are shown (n=4). (C and D) As in A and B except that Myc-RIP1 expression lentivirus was used (n=4). *P<0.05 and **P<0.01 versus 0 µM cisplatin group; #P<0.05 and ##P<0.01 versus vector group.
Figure 9.
Figure 9.
RIP3 or MLKL deficiency reduces many, but not all, inflammatory cytokine levels in proximal tubules of cisplatin-treated mice. (A–E) Proximal tubules from RIP3+/+ and RIP3−/− mice were isolated at 0, 1, 2, 3, or 4 days after cisplatin treatment. Relative mRNA levels of TNF-α, IL-1β, IL-6, IFN-γ, and TWEAK were measured by quantitative RT-PCR (n=6). Gene levels were normalized to the expression of β-actin. (F–J) As in A–E except that MLKL+/+ and MLKL−/− mice were used (n=6). *P<0.05 and **P<0.01 versus day 0 group; #P<0.05 and ##P<0.01 versus WT group.
Figure 10.
Figure 10.
Necroptosis of renal proximal tubular cells is induced directly by cisplatin and indirectly by a combination of cytokines that are induced in cisplatin-treated mice. (A) PTCs were treated with 100 µM cisplatin for indicated time periods and TNF-α, TWEAK, and IFN-γ levels were measured by real-time PCR (n=4). (B) PTCs were cultured with or without 100 ng/ml recombinant TNF for the indicated time periods. Cell survival at each time point is shown (n=4). (C) Cells were treated with cisplatin in the presence or absence of neutralizing TNF-α antibody or Brefeldin A for the indicated time periods. PI-positive cells are shown (n=4). **P<0.01 versus 0 hours. (D) PTCs from MLKL+/+ and MLKL−/− mice were treated with TTI (100 ng/ml TNF-α, 100 ng/ml TWEAK, and 30 U/ml IFN-γ) in the presence or absence of 20 µM zVAD for 24 hours. DMSO was used as vehicle control. PI-positive cells are shown (n=4). **P<0.01 versus control group; ##P<0.01 versus MLKL+/+ group. (E) Freshly isolated renal tubules were cultured for 10 hours in the vehicle control (DMSO), 100 ng/ml recombinant TNF-α, 200 ng/ml TWEAK, and 100 U/ml IFN-γ in the presence or absence of 25 µM zVAD as indicated (n=4). Representative images of PI staining are shown (original magnification, ×100). (F) Proposed model of cisplatin induced-necroptosis.

References

    1. Arany I, Safirstein RL: Cisplatin nephrotoxicity. Semin Nephrol 23: 460–464, 2003 - PubMed
    1. Okada K, Ma D, Warabi E, Morito N, Akiyama K, Murata Y, Yamagata K, Bukawa H, Shoda J, Ishii T, Yanagawa T: Amelioration of cisplatin-induced nephrotoxicity in peroxiredoxin I-deficient mice. Cancer Chemother Pharmacol 71: 503–509, 2013 - PubMed
    1. Faubel S, Ljubanovic D, Reznikov L, Somerset H, Dinarello CA, Edelstein CL: Caspase-1-deficient mice are protected against cisplatin-induced apoptosis and acute tubular necrosis. Kidney Int 66: 2202–2213, 2004 - PubMed
    1. Kim J, Long KE, Tang K, Padanilam BJ: Poly(ADP-ribose) polymerase 1 activation is required for cisplatin nephrotoxicity. Kidney Int 82: 193–203, 2012 - PubMed
    1. Linkermann A, Bräsen JH, Darding M, Jin MK, Sanz AB, Heller JO, De Zen F, Weinlich R, Ortiz A, Walczak H, Weinberg JM, Green DR, Kunzendorf U, Krautwald S: Two independent pathways of regulated necrosis mediate ischemia-reperfusion injury. Proc Natl Acad Sci U S A 110: 12024–12029, 2013 - PMC - PubMed

Publication types

MeSH terms