. 2015 Mar 18;35(11):4552-70.
doi: 10.1523/JNEUROSCI.2061-14.2015.

Selective activation of microglia facilitates synaptic strength

Affiliations

Selective activation of microglia facilitates synaptic strength

Anna K Clark et al. J Neurosci. .

Abstract

Synaptic plasticity is thought to be initiated by neurons only, with the prevailing view assigning glial cells mere specify supportive functions for synaptic transmission and plasticity. We now demonstrate that glial cells can control synaptic strength independent of neuronal activity. Here we show that selective activation of microglia in the rat is sufficient to rapidly facilitate synaptic strength between primary afferent C-fibers and lamina I neurons, the first synaptic relay in the nociceptive pathway. Specifically, the activation of the CX3CR1 receptor by fractalkine induces the release of interleukin-1β from microglia, which modulates NMDA signaling in postsynaptic neurons, leading to the release of an eicosanoid messenger, which ultimately enhances presynaptic neurotransmitter release. In contrast to the conventional view, this form of plasticity does not require enhanced neuronal activity to trigger the events leading to synaptic facilitation. Augmentation of synaptic strength in nociceptive pathways represents a cellular model of pain amplification. The present data thus suggest that, under chronic pain states, CX3CR1-mediated activation of microglia drives the facilitation of excitatory synaptic transmission in the dorsal horn, which contributes to pain hypersensitivity in chronic pain states.

Keywords: chemokine; chronic pain; fractalkine; microglia; spinal cord; synaptic plasticity.


Figures

Figure 1.
Figure 1.
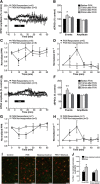
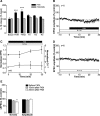
FKN induces rapid enhancement of synaptic transmission. A, B, Iba-1 (red) and p-p38 MAPK (green; colocalization with Iba-1, yellow) immunoreactivity in the dorsal horn of control (A) and FKN (B) spinal cord slices. Scale bar, 50 μm. C, In seven neurons tested, C-fiber-evoked EPSC amplitude stays constant over a recording period of 40 min (p > 0.05, one-way RM ANOVA). D, FKN (200 ng/ml for 30 min, black bar) induced a significant facilitation of C-fiber-evoked EPSC amplitude in 18 of 31 neurons tested [134 ± 6% at 30 min, p < 0.001, one-way RM ANOVA; p < 0.01 compared with control neurons (C), Fisher's exact test]. Filled circles represent neurons showing statistically significant facilitation (p < 0.05, one-way RM ANOVA; FKN Responders); open cycles, neurons showing no change after FKN application (p > 0.05, one-way RM ANOVA; FKN Nonresponders). Insets show individual EPSC traces recorded from a FKN responding neuron at the indicated time points. E, F, Facilitation of C-fiber-evoked EPSC by FKN is associated with a decrease in the PPR (E) and an increase in the CV−2 value (F) compared with pretreatment values (*p < 0.05, **p < 0.01, one-way RM ANOVA). G, H, FKN application is associated with an increase in the number of sEPSCs [G; 148 ± 10% at 10 min, 157 ± 21% at 20 min after FKN (n = 11)] and mEPSCs [H; 139 ± 18% at 10 min, 173 ± 22% at 20 min after FKN (n = 10)] compared with pretreatment values (**p < 0.01, ***p < 0.001, one-way RM ANOVA). Insets show representative traces of sEPSCs. I, In seven neurons tested, Aδ-fiber-evoked EPSC amplitude stays constant over a recording period of 40 min (p > 0.05, one-way RM ANOVA). J, FKN (200 ng/ml for 30 min, black bar) did not modify Aδ-fiber-evoked EPSC amplitude in 12 neurons tested [89 ± 5% at 30 min, p > 0.05, one-way RM ANOVA; p > 0.05 compared with control neurons (I), Fisher's exact test].
Figure 2.
Figure 2.
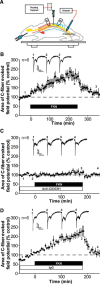
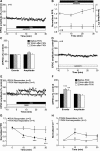
FKN-induced synaptic facilitation is transient in nature. A, FKN (200 ng/ml for 15 min, black bar) induced a significant facilitation of C-fiber-evoked EPSC in 6 of 11 neurons tested, which returned to pretreatment values following washout (125 ± 4% at 15 min, 126 ± 12% at 30 min, p < 0.001; 107 ± 9% at 50 min, p > 0.05; one-way RM ANOVA). Filled circles represent neurons showing facilitation; open cycles represent neurons showing no change after FKN application. B–D, FKN significantly modified sEPSCs (B), PPR (C), and CV−2 (D) during application, with all measures returning to pretreatment values following washout. *p < 0.05, one-way RM ANOVA. E, In identified projection neurons, FKN (200 ng/ml for 15 min, black bar) induced a significant facilitation of C-fiber-evoked EPSCs in 7 of 10 neurons tested, which returned to pretreatment values following washout (124 ± 4% at 15 min, 131 ± 9% at 20 min, p < 0.001; 107 ± 3% at 50 min, p > 0.05; one-way RM ANOVA). Filled circles represent neurons showing facilitation; open circles represent neurons showing no change after FKN application. F–H, FKN-modified sEPSCs (F), PPR (G), and CV−2 (H) during application, with all measures returning to pretreatment values following washout. *p < 0.05, **p < 0.01, one-way RM ANOVA. I, Iba-1 (red) and p-p38 MAPK (green; colocalization with Iba-1, yellow) immunoreactivity in the dorsal horn of spinal cord slices following 15 min incubation with FKN, 15 min FKN followed by a 30 min washout period, and time-matched control slices for each condition. Scale bars, 50 μm. J, Quantification of the percentage of Iba-1-positive microglial cells expressing immunoreactivity for p-p38 MAPK in the dorsal horn of spinal cord slices.
Figure 3.
Figure 3.
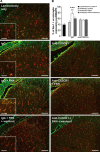
FKN-induced synaptic facilitation in vivo is CX3CR1 dependent. The area of the C-fiber-evoked field potential (percentage of control) is plotted against time (in minutes). A, Schematic drawing of the recording setup for in vivo experiments. B, Application of FKN (200 ng/ml for 240 min, black bar) to the spinal cord induced a facilitation of C-fiber-evoked field potentials in all rats tested, which returned to pretreatment values following washout (223 ± 28% at 240 min, p > 0.001; 111 ± 7% at 370 min, p < 0.05; one-way RM ANOVA). C, FKN-induced facilitation was completely prevented by spinal application of a CX3CR1 neutralizing antibody (rabbit anti-CX3CR1; 60 μg/ml; 1 h before FKN application, open bar; 110 ± 12% at 180 min, p > 0.05, one-way RM ANOVA). D, FKN-induced facilitation was evident following spinal application of control IgG (rabbit IgG; 60 μg/ml; 1 h before FKN application, open bar; 217 ± 19% at 180 min, p > 0.05, one-way RM ANOVA).
Figure 4.
Figure 4.
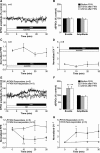
FKN induced microglia reactivity in vivo. A, Iba-1 (red) and p-p38 MAPK (green; colocalization with Iba-1, yellow) immunoreactivity in the dorsal horn of the spinal cord following in vivo experiments. Spinal cords were excised under the following conditions: laminectomy only, IgG alone, IgG plus FKN for 180 min, IgG plus FKN plus washout for 60 min, anti-CX3CR1 alone, anti-CX3CR1 plus FKN for 180 min, and anti-CX3CR1 plus FKN plus washout. Scale bars: low-magnification panels, 200 μm; higher-magnification panels, 100 μm. n = 4 rats/group. B, Quantification of the percentage of Iba-1-positive microglial cells expressing immunoreactivity for p-p38 MAPK in the dorsal horn of the spinal cord.
Figure 5.
Figure 5.
The effects of FKN are mediated by microglial CX3CR1. A–D, In the presence of anti-FKN (goat anti-FKN; 2 μg/ml for 1 h preincubation then 1 μg/ml for duration of the recording, open bar), FKN (black bar) does not modify C-fiber-evoked EPSCs (A), sEPSCs (B), PPR (C), or CV−2 (D) in any neuron tested. p > 0.05, one-way RM ANOVA. E, In the presence of control IgG (goat IgG; 2 μg/ml for 1 h preincubation then 1 μg/ml for the duration of the recording, open bar), FKN (black bar) induced a significant facilitation of C-fiber-evoked EPSC amplitude in five of eight neurons tested [124 ± 4% at 30 min, p < 0.01, one-way ANOVA; p < 0.05 compared with anti-FKN cells (A), Fisher's exact test]. Filled circles represent neurons showing facilitation; open circles represent neurons showing no change after FKN application. F, FKN application following IgG preincubation is associated with an increase in the number of sEPSCs [149 ± 13% at 10 min, 147 ± 16% at 20 min after FKN (n = 8)] compared with pretreatment values (**p < 0.01, one-way RM ANOVA). G, H, Following IgG application, facilitation of C-fiber-evoked EPSCs by FKN is associated with a decrease in the PPR (G) and an increase in the CV−2 value (H) compared with pretreatment values (*p < 0.05, **p < 0.01, one-way RM ANOVA).
Figure 6.
Figure 6.
FKN-induced facilitation is inhibited by minocycline. A, Incubation of slices with minocycline (100 μm for 90 min preincubation then 20 μm for the duration of the recording, open bar) completely prevents the effects of FKN (black bar) on C-fiber-evoked EPSCs. p > 0.05, one-way RM ANOVA. B, In six neurons tested, C-fiber-evoked EPSC amplitude stays constant in the presence of minocycline alone (open bar, p > 0.05, one-way RM ANOVA). C–E, In the presence of minocycline FKN-induced changes in PPR (C), CV−2 (D), and sEPSCs (E) are prevented in all neurons tested. p > 0.05, one-way RM ANOVA.
Figure 7.
Figure 7.
Release of IL-1β is critical for FKN-induced facilitation. A, Superfusion of FKN (200 ng/ml for 16 min) resulted in a significant release of IL-1β from the dorsal horn (n = 13 slices; black columns; ***p < 0.001 compared with basal values, one-way ANOVA). Minocycline (MIN) incubated before and during FKN superfusion (100 μm; 24 min in total) inhibits FKN-evoked IL-1β release (n = 12 slices; gray columns; p > 0.05 compared with basal values, one-way ANOVA). Basal release: FKN = 21.48 ± 1.69 pg/8 ml fraction. FKN+MIN = 23.06 ± 0.79 pg/8 ml fraction. B–E, In the presence of IL-1ra (40 ng/ml for 20 min preincubation and the duration of the recording, open bar), FKN-induced facilitation of C-fiber-evoked EPSCs (B) and changes in PPR (C; black circles, left hand axis) and CV−2 (C; white squares, right hand axis) were prevented in all neurons tested (B, C; p > 0.05, one-way RM ANOVA), while a decrease in the number of sEPSCs occurred (E; 81 ± 7% at 20 min after FKN [n = 8]; *p < 0.05, one-way RM ANOVA). C-fiber-evoked EPSC amplitude stays constant in the presence of IL-1ra alone (D; open bar, p > 0.05, one-way RM ANOVA).
Figure 8.
Figure 8.
FKN-induced facilitation is independent of TNF signaling. A, In the presence of sTNF R1 (0.5 μg/ml for 20 min preincubation and the duration of the recording, open bar), FKN (black bar) induced a significant facilitation of C-fiber-evoked EPSC amplitude in 6 of 11 neurons tested (126 ± 7% at 30 min, p < 0.01, one-way ANOVA; p < 0.05 compared with control cells [B], Fisher's exact test). Filled circles represent neurons showing facilitation; open circles represent neurons showing no change after FKN application. B, In six neurons tested, the C-fiber-evoked EPSC amplitude stays constant in the presence of sTNF R1 alone (open bar, p > 0.05, one-way RM ANOVA). C, D, Following sTNF R1, facilitation of C-fiber-evoked EPSCs by FKN is associated with a decrease in the PPR (C) and an increase in the CV−2 value (D) compared with pretreatment values (*p < 0.05, one-way RM ANOVA). E, FKN application following sTNF R1 preincubation is associated with an increase in the number of sEPSCs [121 ± 3% at 10 min, 131 ± 7% at 20 min after FKN (n = 10)] compared with pretreatment values (***p < 0.001, one-way RM ANOVA).
Figure 9.
Figure 9.
FKN-induced facilitation requires postsynaptic Ca2+ signaling and NMDA receptors. A–C, Inclusion of BAPTA (20 mm, open bar) in the pipette solution to block Ca2+ signaling in the postsynaptic neuron completely prevented FKN-induced changes to C-fiber-evoked EPSC (A), PPR (B; black circles, left hand axis) and CV−2 (B; white squares, right hand axis), in all neurons tested (A, B; p > 0.05, one-way RM ANOVA). However, a significant increase in the number of sEPSCs still occurred [C; 136 ± 14% at 10 min after FKN application (n = 8); *p > 0.05, one-way RM ANOVA]. D–F, The addition of MK801 (1 mm, open bar) to the pipette solution in order to specifically inhibit postsynaptic NMDA receptors prevents the effects of FKN on C-fiber-evoked EPSCs (D), PPR (E; black circles, left hand axis), and CV−2 (E; white squares, right hand axis) in all neurons tested (D, E; p > 0.05, one-way RM ANOVA). However, a significant increase in the number of sEPSCs still occurred [F; 132 ± 12% at 10 min after FKN (n = 8); *p > 0.05, one-way RM ANOVA].
Figure 10.
Figure 10.
d-Serine is not required for FKN-induced facilitation. A, In the presence of D-AAO (0.2 U/ml for 1 h preincubation and the duration of the recording, open bar) to degrade d-serine, FKN (black bar) induced a significant facilitation of C-fiber-evoked EPSC amplitude in five of nine neurons tested [138 ± 5% at 30 min, p < 0.001, one-way ANOVA; p < 0.05 compared with control cells (B), Fisher's exact test]. Filled circles represent neurons showing facilitation; open circles represent neurons showing no change after FKN application. B, In six neurons tested, C-fiber-evoked EPSC amplitude stays constant in the presence of D-AAO alone (open bar, p > 0.05, one-way RM ANOVA). C, D, Following D-AAO application, facilitation of C-fiber-evoked EPSCs by FKN is associated with a decrease in the PPR (C) and an increase in the CV−2 value (D) compared with pretreatment values (***p < 0.001, **p < 0.01, one-way RM ANOVA). E, Application of FKN following D-AAO is associated with an increase in the number of sEPSCs [153 ± 11% at 10 min, 188 ± 27% at 20 min after FKN application (n = 9)] compared with pretreatment values (**p < 0.01, *p < 0.05, one-way RM ANOVA).
Figure 11.
Figure 11.
The facilitatory effects of FKN are mediated by NO. A–C, In the presence of cPTIO (30 μm for 30 min preincubation and the duration of the recording, open bar) FKN-induced facilitation of C-fiber-evoked EPSC (A), changes in PPR (B; black circles, left hand axis) and CV−2 (B; white squares, right hand axis), and sEPSCs (C) was completely prevented in all neurons tested (p > 0.05, one-way RM ANOVA). D–F, Following incubation of slices with 1400W (3 μm for 30 min preincubation and the duration of the recording, open bar), FKN does not modify C-fiber-evoked EPSCs (D), PPR (E; black circles, left hand axis), CV−2 (E; white squares, right hand axis), or sEPSCs (F) in any of the neurons tested (p > 0.05, one-way RM ANOVA). G, H, C-fiber-evoked EPSC amplitude stays constant in the presence of cPTIO alone (G; open bar) or 1400W alone (H; open bar). p > 0.05, one-way RM ANOVA.
Figure 12.
Figure 12.
The facilitatory effects of FKN are mediated by PLA2. A–C, Inhibition of PLA2 (AACOCF3; 10 μm for 20 min preincubation then for the duration of the recording, open bar) prevents the effects of FKN (black bar) on C-fiber-evoked EPSCs (A), PPR (B; black circles, left hand axis), CV−2 (B; white squares, right hand axis), and sEPSCs (C) in all neurons tested (p > 0.05, one-way RM ANOVA). D, C-fiber-evoked EPSC amplitude stays constant in the presence of AACOCF3 alone (open bar, p > 0.05, one-way RM ANOVA). E, In the presence of DMSO (0.05% final concentration; for 20 min preincubation then for the duration of the recording, open bar), FKN (black bar) induced a significant facilitation of C-fiber-evoked EPSC amplitude in five of nine neurons tested [125 ± 4% at 30 min, p < 0.01, one-way ANOVA; p < 0.05 compared with AACOCF3 cells (A), Fisher's exact test]. Filled circles represent neurons showing facilitation; open circles represent neurons showing no change after FKN application. F, FKN application following DMSO preincubation is associated with an increase in the number of sEPSCs [132 ± 7% at 10 min, 127 ± 7% at 20 min after FKN (n = 9)] compared with pretreatment values (**p < 0.01, one-way RM ANOVA). G, H, Following DMSO application, facilitation of C-fiber-evoked EPSCs by FKN is associated with a decrease in the PPR (G) and an increase in the CV−2 value (H) compared with pretreatment values (*p < 0.05, **p < 0.01, one-way RM ANOVA).
Figure 13.
Figure 13.
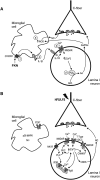
Schematic of the proposed mechanism of FKN-induced synaptic facilitation. A, We propose a novel mechanism by which FKN induces synaptic facilitation. Activation of microglial CX3CR1 receptors (1) results in the release of IL-1β (2), which acts to modulate postsynaptic NMDA receptors (3). Increased intracellular Ca2+ in the postsynaptic neuron stimulates synthesis of AA via PLA2 (4). AA/PGs feed back onto the microglial cells, where they induce iNOS activity and subsequent NO production (5), which modulates presynaptic neurotransmitter release. AA/PGs may also act directly on the presynaptic neuron. MPL, Membrane phospholipids. B, The proposed mechanism of FKN-induced facilitation is in contrast with the traditional mechanisms of activity-dependent LTP. At synapses between C-fibers and lamina I neurons, HFS/LFS triggers the release of the excitatory neurotransmitters glutamate and substance P, leading to depolarization of the postsynaptic cell. Potentiation of synaptic strength requires activation of T-type VDCCs (leading to Ca2+ influx), NK1 receptors, release of Ca2+ from intracellular stores, and activation of intracellular proteases, including PLC, PKC, and CaMKII, which lead to the phosphorylation of glutamate receptors. Several microglial signaling mechanisms may also contribute, including the P2X7 receptor and intracellular signaling via p38 MAPK and Src. AMPAR, AMPA receptor; CaMKII, Ca2+-calmodulin dependent kinase II; HFS, high-frequency stimulation; IP3R, inositol 1,4,5-trisphosphate receptor; LFS, low-frequency stimulation; NK1R, neurokinin receptor 1; NMDAR, NMDA receptor; nNOS, neuronal nitric oxide synthase; PKC, protein kinase C; PLC, phospholipase C; RyR, ryanodine receptor; VDCC, voltage-dependent Ca2+ channel.

References

    1. Agulhon C, Fiacco TA, McCarthy KD. Hippocampal short- and long-term plasticity are not modulated by astrocyte Ca2+ signaling. Science. 2010;327:1250–1254. doi: 10.1126/science.1184821. - DOI - PubMed
    1. Ben Achour S, Pascual O. Glia: the many ways to modulate synaptic plasticity. Neurochem Int. 2010;57:440–445. doi: 10.1016/j.neuint.2010.02.013. - DOI - PubMed
    1. Bender VA, Bender KJ, Brasier DJ, Feldman DE. Two coincidence detectors for spike timing-dependent plasticity in somatosensory cortex. J Neurosci. 2006;26:4166–4177. doi: 10.1523/JNEUROSCI.0176-06.2006. - DOI - PMC - PubMed
    1. Berta T, Park CK, Xu ZZ, Xie RG, Liu T, Lü N, Liu YC, Ji RR. Extracellular caspase-6 drives murine inflammatory pain via microglial TNF-alpha secretion. J Clin Invest. 2014;124:1173–1186. doi: 10.1172/JCI72230. - DOI - PMC - PubMed
    1. Bliss TV, Collingridge GL. A synaptic model of memory: long-term potentiation in the hippocampus. Nature. 1993;361:31–39. doi: 10.1038/361031a0. - DOI - PubMed

Publication types