. 2015 Mar 18;35(11):4641-56.
doi: 10.1523/JNEUROSCI.2339-14.2015.

Long-latency reductions in gamma power predict hemodynamic changes that underlie the negative BOLD signal

Affiliations

Long-latency reductions in gamma power predict hemodynamic changes that underlie the negative BOLD signal

Luke Boorman et al. J Neurosci. .

Abstract

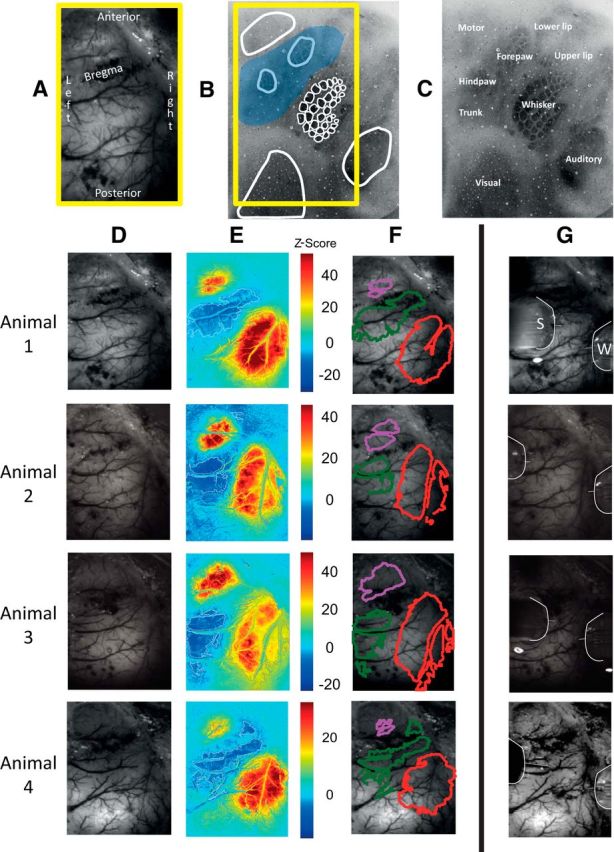
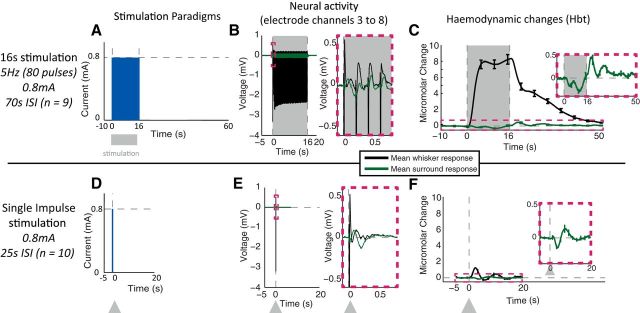
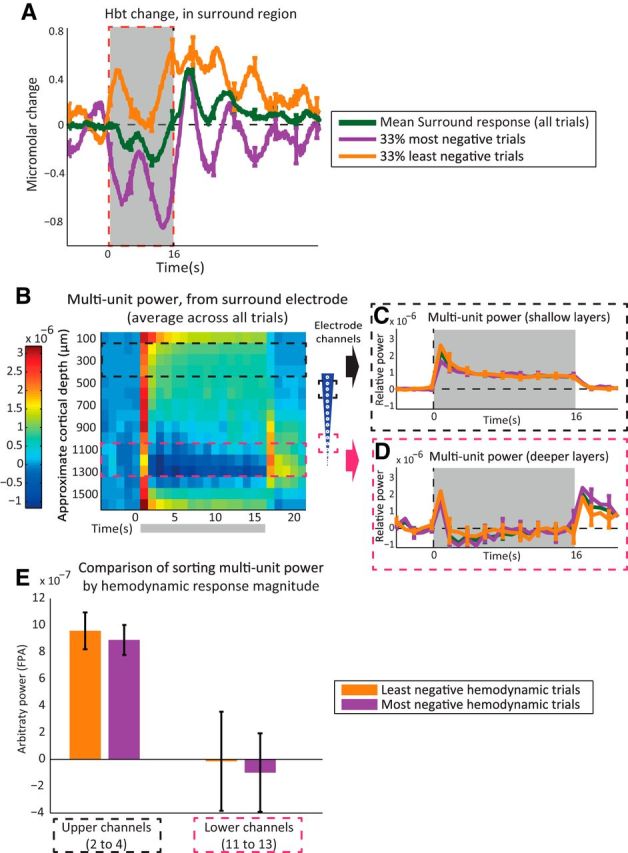
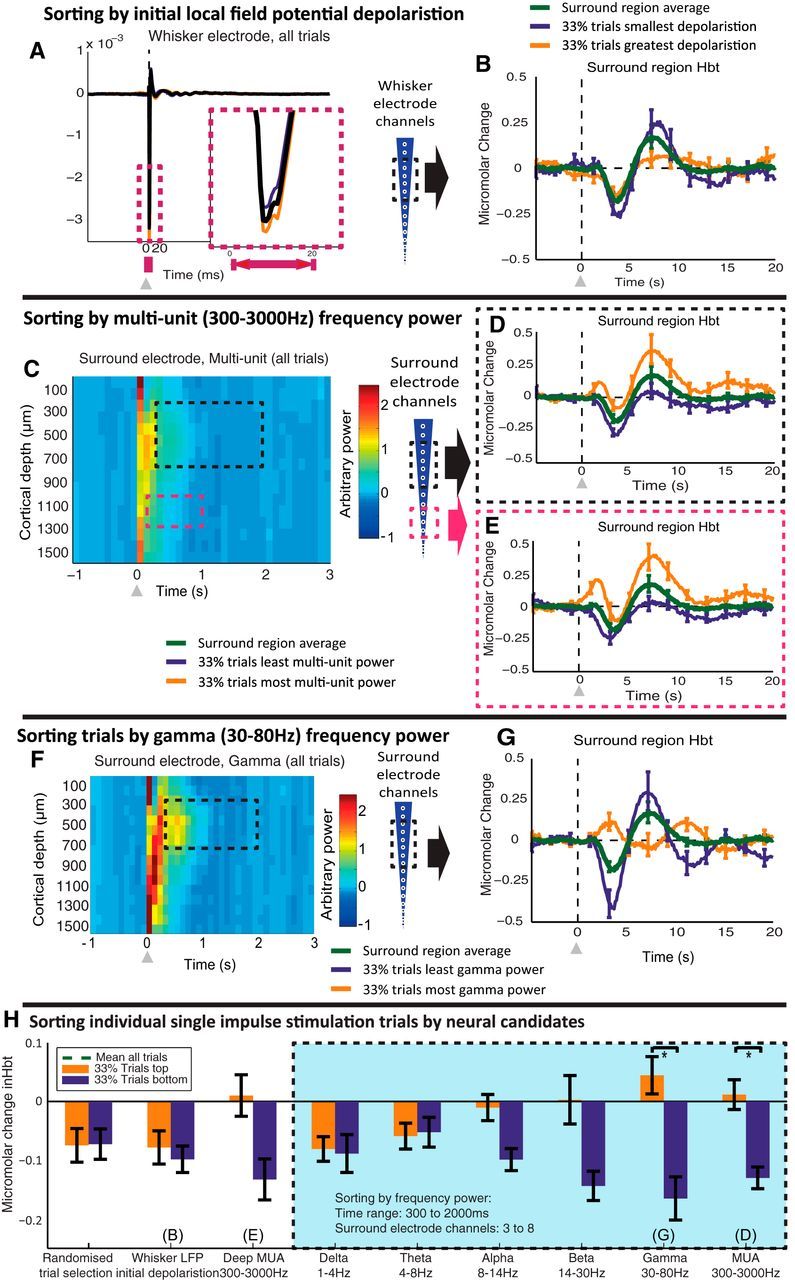
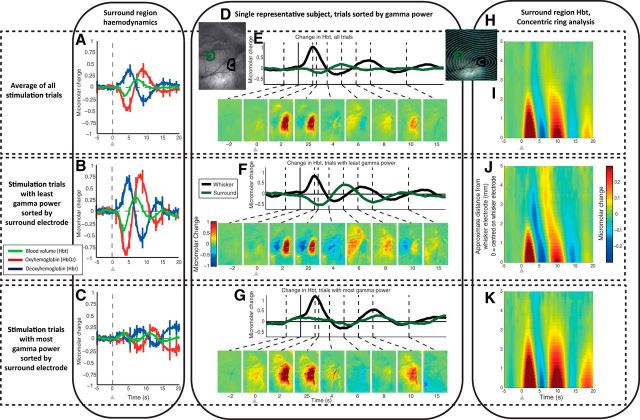
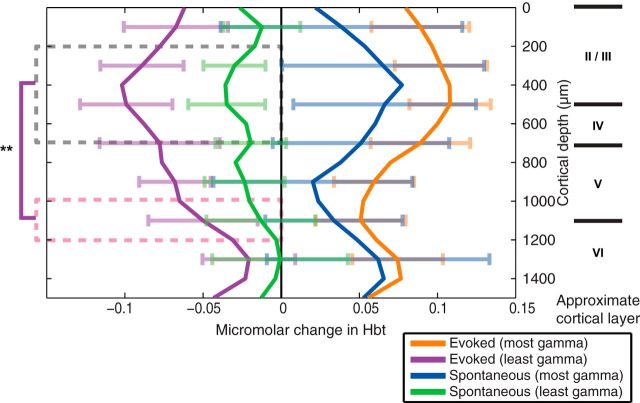
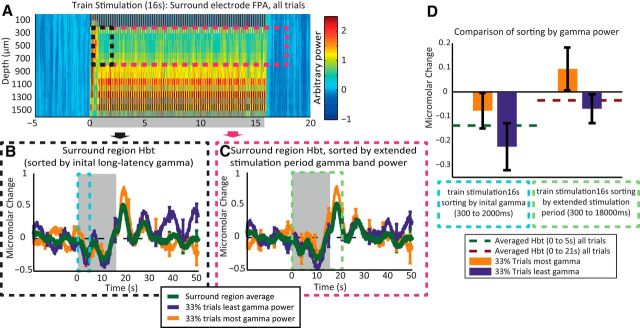
Studies that use prolonged periods of sensory stimulation report associations between regional reductions in neural activity and negative blood oxygenation level-dependent (BOLD) signaling. However, the neural generators of the negative BOLD response remain to be characterized. Here, we use single-impulse electrical stimulation of the whisker pad in the anesthetized rat to identify components of the neural response that are related to "negative" hemodynamic changes in the brain. Laminar multiunit activity and local field potential recordings of neural activity were performed concurrently with two-dimensional optical imaging spectroscopy measuring hemodynamic changes. Repeated measurements over multiple stimulation trials revealed significant variations in neural responses across session and animal datasets. Within this variation, we found robust long-latency decreases (300 and 2000 ms after stimulus presentation) in gamma-band power (30-80 Hz) in the middle-superficial cortical layers in regions surrounding the activated whisker barrel cortex. This reduction in gamma frequency activity was associated with corresponding decreases in the hemodynamic responses that drive the negative BOLD signal. These findings suggest a close relationship between BOLD responses and neural events that operate over time scales that outlast the initiating sensory stimulus, and provide important insights into the neurophysiological basis of negative neuroimaging signals.

Keywords: fMRI; gamma power; long latency; negative BOLD; neurovascular coupling; whisker barrel cortex.


Figures

Figure 1.
Figure 1.
Spatial hemodynamic responses evoked by 0.8 mA electrical stimulation of the whisker pad (2 s train of pulses presented at 5 Hz) from four representative animals. A, In vivo grayscale CCD camera image of thinned cranial window, which includes the primary somatosensory and motor cortices. Midline is to the left. B, C, Postmortem histological section (50 μm thick) centered on the S1 whisker barrel field and stained for cytochrome oxidase. The whisker barrels and surrounding anatomically mapped regions have been outlined and labeled. The blue overlaid patch represents the approximate location of the negative hemodynamic changes that occurred in response to stimulation of the whole whisker pad. D, In vivo grayscale CCD camera image of thinned cranial window. E, Activation map of change in Hbt, generated by statistical parametric mapping (SPM) GLM with boxcar hemodynamic response function. Scale bar represents z-score. F, Regions of interest selected from activation map in B. Regions having Hbt increases were selected by taking pixels having a z-scores >50% of the maximum z-score, while regions having Hbt decreases were selected by taking pixels having a z-score <50% of the minimum z-score. Red represents an increase in Hbt, overlying the activated whisker barrel field. Green represents surrounding regions of decreased Hbt and purple represents the increase in Hbt and overlies the primary motor cortex. G, Outline of multichannel recording electrodes inserted into the whisker barrel region (W) and surround region (S).
Figure 2.
Figure 2.
Whisker stimulation paradigms. A, D, Temporal profile of pulse(s) of electrical stimuli presented to whisker pad. B, E, LFP neural responses, recorded in whisker barrel and surrounding regions, averaged across stimulation trials and across electrode channels 3–8 (equating to 250–750 μm below the cortical surface). C, F, Time series of changes in Hbt, generated from regions of interest overlying the activated whisker barrel cortex and surrounding regions, averaged across stimulation trials. Stimulation period represented with gray boxes and arrows. Error bars represent SEM across subjects. Responses averaged across subjects (n = 10 for single impulse and n = 9 for 16 s train stimulation paradigm).
Figure 3.
Figure 3.
Sorting of hemodynamic responses evoked by presentation of 16 s train (5 Hz) electrical stimulation to the whisker pad. A, Change in Hbt, generated from a region surrounding the activated whisker barrel cortex, having a negative hemodynamic response. Individual stimulation trial hemodynamic responses were sorted by area of response during stimulation (0–16 s). Green, Mean of all trials (100%). Purple, Most-negative trials (33%). Orange, Least-negative trials (33%). B, MUA (300–3000 Hz) frequency power analysis (1 s bins) of neural activity recorded from surround region electrode. C, Time series of MUA power from surround electrode, upper channels (2–4), with average response from all trials (green) and trials sorted by surround hemodynamic response area. D, MUA power from surround electrode lower channels (11–13). E, Averaged MUA power over period of stimulation (0–16 s), comparing trial sorting of neural responses by magnitude of surround region hemodynamic response, from upper and lower electrode channels. Stimulation period represented with gray boxes. Error bars represent SEM across subjects. Responses averaged across subjects (n = 10).
Figure 4.
Figure 4.
Sorting single-impulse stimulation trials by neural candidates. A, LFP recorded from whisker barrel electrode, averaged across channels 3–8. Inset shows main negative component of LFP. Individual stimulation trials were sorted by the magnitude of the LFP recorded in whisker barrels for 0–20 ms after stimulus presentation. Turquoise, LFP of least-negative trials (33%). Orange, LFP of most-negative trials (33%). B, Change in Hbt in surround region. Green, Average response (100% of trials) with trials sorted by whisker region-evoked LFP (0–20 ms after stimulus presentation). C, Multiunit (300–3000 Hz) power recorded from surround region. Average response from all single-impulse stimulation trials. D, Stimulus-evoked change in Hbt in surround region, sorted by MUA power in upper cortical layers (channels 3–8), of the surround electrode (300–2000 ms after stimulus presentation). E, Stimulus-evoked change in Hbt in surround region, sorted by MUA power in deeper cortical layers (channels 11–13), of the surround electrode (100–1000 ms after stimulus presentation). F, Gamma (30–80 Hz) power recorded from surround region electrode. Average response from all single-impulse stimulation trials. G, Stimulus-evoked change in Hbt in surround region, with individual trials sorted by gamma power in upper cortical layers (channels 3–8), of the surround electrode (300–2000 ms after stimulus presentation). H, Comparison of trial sorting by each neural candidate. Each bar represents the change in Hbt in the surrounding regions averaged between 0 and 5 s after stimulus presentation, with the top and bottom 33% of trials selected dependent on the various neural markers or a randomized vector of trials. The green dotted line represents the surround region Hbt response averaged between 0 and 5 s after stimulus presentation and averaged across all stimulation trials. The line offers a reference to show the difference from the mean of each of the Hbt responses that arise after sorting by each neural metric. The overlaid blue box represents the hemodynamic trials sorted by each frequency range, taking the neural data for the long latency period after stimulus presentation (300–2000 ms) and from channels 3–8 of the surround electrode. Paired t tests used to assess reliability of each sorting approach. *p <0.05 (Bonferroni corrected for multiple comparisons α = 0.05/9, p level <0.0056). Error bars represent SEM across subjects. Responses averaged across subjects (n = 10).
Figure 5.
Figure 5.
Spatial–temporal representation of hemodynamic changes evoked by single-impulse stimulation, sorted by gamma power (30–80 Hz) from the upper cortical layers (channels 3–8) of the surround electrode (300–2000 ms after stimulus presentation). A, Hemodynamic response in surround region, evoked by single-impulse stimulation of the whisker pad, average of all trials. B, Hemodynamic response in surround region, average of trials (33%) having the least gamma power in the surround region, in the upper cortical layers (channels 3–8). C, Hemodynamic response in surround region, average of trials (33%) having the most gamma power in the surround region, in the upper cortical layers. D, In vivo grayscale image of thinned cranial window from a single representative subject, with regions of interest around the two recording electrodes used for time-series generation. E–G, Averaged Hbt changes, evoked by single-impulse stimulation from a single representative subject, all trials (100%), least gamma (33%) and most gamma (33%) respectively, and gamma power recorded from surround electrode. Hbt changes in the whisker region response (black) and surround region response (green). Montage of images shows spatial maps of micromolar changes in Hbt. Each is averaged over a second and represents a corresponding time point in the stimulation trial. Increases in Hbt are toward the red color range, with blue representing negative changes. H, In vivo grayscale camera image of thinned cranial window from a single representative subject, with a series of concentric rings centered on the whisker barrel electrode. These were used to select pixels for selection of data as a function of distance away from the electrode. I–K, Hbt changes, with data from all trials, least gamma power (33%) and most gamma power (33%) respectively. The y-axis represents distance away from the tip of the whisker electrode, with each row in the image generated from pixels within each concentric ring. Stimulation represented with arrows. Error bars represent SEM across subjects. Responses averaged across subjects (n = 10), except for single subject (D–H).
Figure 6.
Figure 6.
Surround region stimulus-evoked and spontaneous hemodynamic responses, sorted by long-latency gamma-band activity (300–2000 ms) on a channel-by-channel basis. The area of the hemodynamic response was taken between 0 and 5 s after stimulus presentation and the mean response from all trials subtracted to allow comparison between the stimulation and spontaneous (nonstimulation) hemodynamic time series, when sorted by gamma power. Channels 3–8 and 11–13 were averaged and a one-way ANOVA applied to check for differences between sorting by the deep and shallow channels (**p < 0.001). Error bars represent SEM across subjects. Responses averaged across subjects (n = 10).
Figure 7.
Figure 7.
Sorting 16 s train stimulation trials by gamma-band activity. A, Gamma (30–80 Hz) power recorded from surround region electrode, average response from all 16 s train stimulation trials. B, Stimulus-evoked change in Hbt in surround region, with individual trials sorted by gamma power in upper cortical layers (channels 3–8), of the surround electrode (300–2000 ms after stimulus presentation). C, Stimulus-evoked change in Hbt in surround region, with individual trials sorted by gamma power in upper cortical layers (channels 3–8), of the surround electrode (300–18,000 ms after stimulus presentation). D, Comparison of trial sorting by gamma, with different time ranges. The left two bars represent the change in Hbt in the surrounding regions averaged between 0 and 5 s after the start of stimulus presentation, with the top and bottom 33% of trials selected by taking the long-latency gamma range (300 and 2000 ms after stimulus onset). The green dotted line represents the surround region Hbt response averaged between 0 and 5 s after stimulus presentation and averaged across all stimulation trials. The green dotted line offers a reference to show the difference from the mean of each Hbt response when sorted by each neural metric. The right two bars represent the change in Hbt in the surrounding regions averaged between 0 and 21 s after stimulus presentation, with the top and bottom 33% of trials selected by taking the extended gamma between (300 and 18,000 ms). The red dotted line represents the surround region Hbt response averaged between 0 and 21 s after stimulus presentation and averaged across all stimulation trials. Stimulation period represented with gray boxes. Error bars represent SEM across subjects. Responses averaged across subjects (n = 9).

References

    1. Armstrong-James M, Fox K, Das-Gupta A. Flow of excitation within rat barrel cortex on striking a single vibrissa. J Neurophysiol. 1992;68:1345–1358. - PubMed
    1. Attwell D, Buchan AM, Charpak S, Lauritzen M, Macvicar BA, Newman EA. Glial and neuronal control of brain blood flow. Nature. 2010;468:232–243. doi: 10.1038/nature09613. - DOI - PMC - PubMed
    1. Bartos M, Vida I, Jonas P. Synaptic mechanisms of synchronized gamma oscillations in inhibitory interneuron networks. Nat Rev Neurosci. 2007;8:45–56. doi: 10.1038/nrn2044. - DOI - PubMed
    1. Berwick J, Johnston D, Jones M, Martindale J, Martin C, Kennerley AJ, Redgrave P, Mayhew JE. Fine detail of neurovascular coupling revealed by spatiotemporal analysis of the hemodynamic response to single whisker stimulation in rat barrel cortex. J Neurophysiol. 2008;99:787–798. doi: 10.1152/jn.00658.2007. - DOI - PMC - PubMed
    1. Boorman L, Kennerley AJ, Johnston D, Jones M, Zheng Y, Redgrave P, Berwick J. Negative blood oxygen level dependence in the rat: a model for investigating the role of suppression in neurovascular coupling. J Neurosci. 2010;30:4285–4294. doi: 10.1523/JNEUROSCI.6063-09.2010. - DOI - PMC - PubMed

Publication types