. 2015 Mar 14;7(1):24.
doi: 10.1186/s13148-015-0063-7. eCollection 2015.

The role of microRNA-1246 in the regulation of B cell activation and the pathogenesis of systemic lupus erythematosus

Affiliations

The role of microRNA-1246 in the regulation of B cell activation and the pathogenesis of systemic lupus erythematosus

Shuangyan Luo et al. Clin Epigenetics. .

Abstract

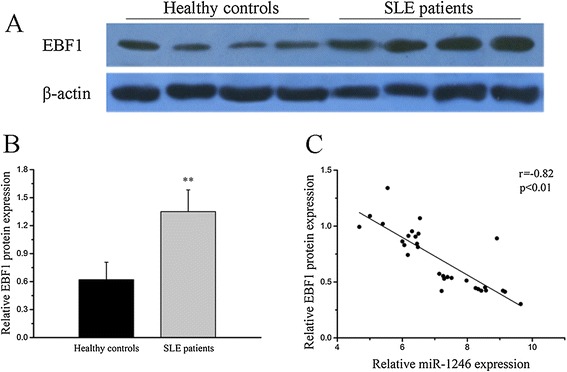
Background: The pathogenesis of systemic lupus erythematosus (SLE) has not yet been completely elucidated. One of the hallmarks of SLE is the production of autoantibodies by uncontrolled over-activated B cells. Early B cell factor 1 (EBF1) contributes to the development, activation, and proliferation of B cells through activation of the AKT signaling pathway. Accumulating evidence has demonstrated that several microRNAs (miRNAs) contribute to the pathogenesis of autoimmune diseases through the regulation of B cells in SLE. We aim to investigate the expression patterns of miR-1246 in B cells and its contribution to pathogenesis of SLE.

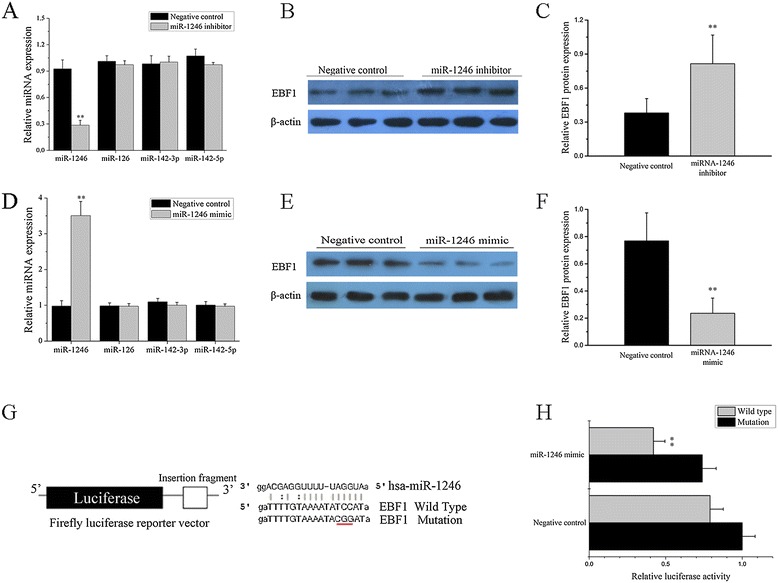
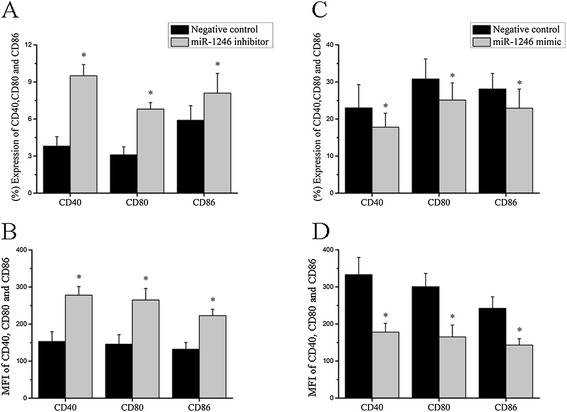
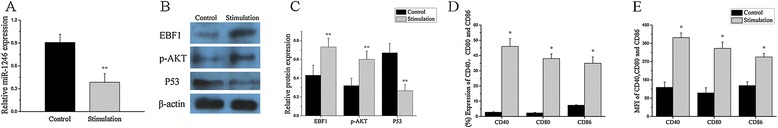
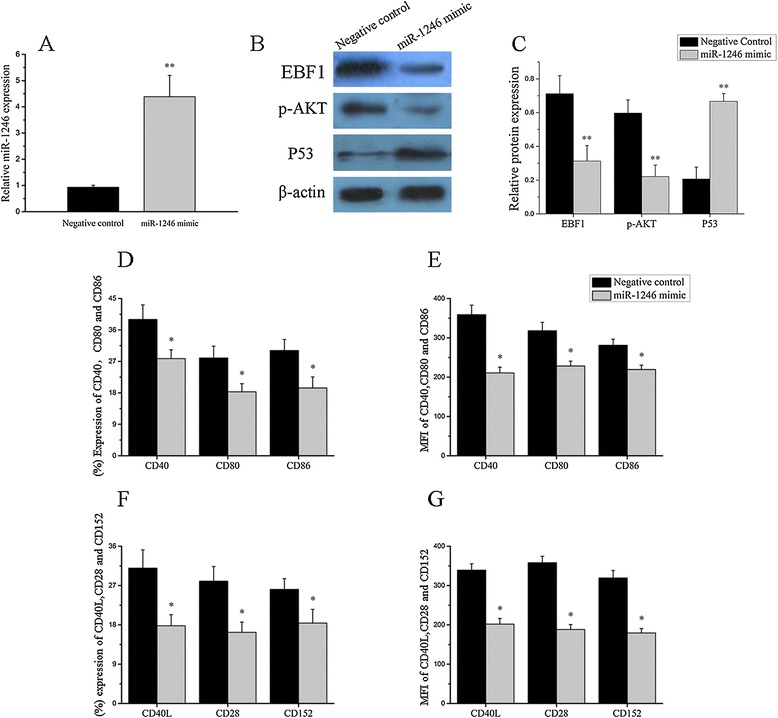
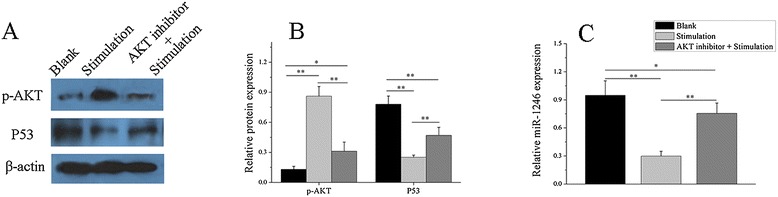
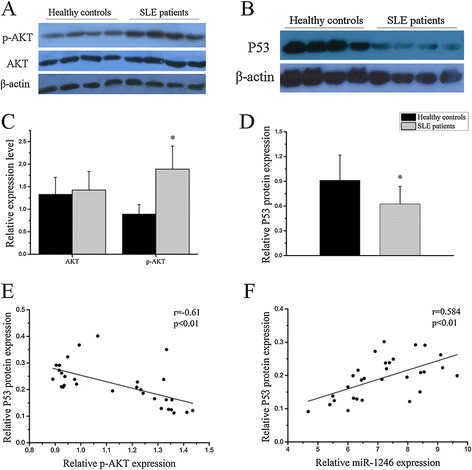
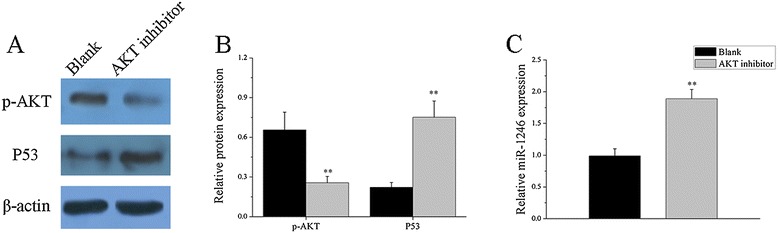
Results: Our results showed that the expression of miR-1246 was significantly decreased in B cells from SLE patients. We verified that miR-1246 specifically targeted the EBF1 messenger RNA (mRNA) by interacting with its 3'-untranslated region (3'-UTR) and regulated the expression of EBF1. Transfection of miR-1246 inhibitors into healthy B cells upregulated the expression of EBF1, enhanced B cell function, and increased the production of B cell surface co-stimulatory molecules CD40, CD80, and CD86. We also observed that abnormal activation of the AKT signaling pathway was associated with decreased P53 expression, leading to the downregulation of the miR-1246 expression; and upregulation of the miR-1246 expression reversed the responsiveness of B cells by inhibiting EBF1 expression.

Conclusions: Activated B cells in lupus could decrease the expression of miR-1246 through the AKT-P53 signaling pathway, which in turn enhances the expression of EBF1, thereby promoting further activation of B cells. Conversely, upregulation of miR-1246 could interrupt this amplification pathway. Our findings thus provide a theoretical framework towards the research of novel biological targets in SLE treatment.

Keywords: AKT; B cell; Co-stimulatory molecules; EBF1; Has-miR-1246; P53; Systemic lupus erythematosus.


Figures

Figure 1
Figure 1
Decreased has-miR-1246 expression in B cells from systemic lupus erythematosus (SLE). (A) High-throughput miRNA microarray of the activities of 371 miRNAs isolated from B cells of healthy controls (n = 11) and active SLE patients (n = 11). Imbalance of green and red signal signifies non-equivalent activities. (B) Scatter plot of the results in (A); down-expressed miRNAs in active SLE patient samples are indicated by the green oval. (C) Fold-change of the six miRNAs was found to differ between SLE and control samples. (D, E) Expression of miR-1246 as measured by miRNA real-time reverse transcription-polymerase chain reaction (RT-PCR) in B cells from 30 active SLE patients (19 were being treated with corticosteroids, antimalarials, or immunosuppressive agents and 11 were untreated), 20 inactive SLE patients, and 20 age- and sex-matched healthy control subjects. Transcript levels were significantly reduced in patients with active SLE, regardless of whether they were receiving concurrent medications, while no significant difference between healthy controls and inactive SLE patients. Bars in (D, E) show the mean ± SD results in 20 healthy donors, 30 patients with active SLE, and 20 patients with inactive SLE. All experiments were performed in triplicate. (**P < 0.01).
Figure 2
Figure 2
Identification of miR-1246 target mRNAs in systemic lupus erythematosus (SLE) B cells. (A, B) Early B cell factor 1 (EBF1) protein level in B cells from active SLE patients (n = 30) and healthy controls (n = 20). EBF1 expression was significantly increased in active SLE B cells compared with that in control B cells. Representative Western blotting and quantitative analysis of the band intensities of control (n = 4) and SLE (n = 4) samples normalized to β-actin is shown at the bottom. (C) In B cells derived from active patients with SLE, has-miR-1246 transcript levels were negatively correlated with the levels of EBF1 protein (r = −0.82, P < 0.01, n = 30). (**P < 0.01).
Figure 3
Figure 3
Verification of miR-1246 target genes. (A-C) The expression levels of miR-1246, miR-126, miR-142-3p, and miR-142-5p (A) and early B cell factor 1 (EBF1) protein (B, C) were analyzed after transfection with miR-1246 inhibitor or inhibitor control. (D-F) The expression levels of miR-1246, miR-126, miR-142-3p, miR-142-5p (D), and EBF1 protein (E, F) were analyzed after transfection with the miR-1246 mimic or mimic control. Bars show the mean ± SD results in three healthy donors or three patients with active SLE. All experiments were performed in triplicate. The Western blot image is a representative image (n = 3). (G) Schematic representation of the EBF1 luciferase reporter construct is shown. The sequence of the miR-1246 binding site in the 3′-untranslated region (3′-UTR) of EBF1 (gray box) is shown on the left. Mutated residues are shown in red. (H) Relative firefly luciferase activity in Jurkat cells co-transfected with an empty vector (mimic control) or an miR-1246 mimic, together with luciferase reporter constructs containing either a wild-type (WT) or a mutated (Mut) EBF1 3′-UTR are shown. Values in (H) are the mean ± SD results from three independent experiments. (**P < 0.01).
Figure 4
Figure 4
MiR-1246 represses B cell responsiveness. (A, B) Inhibiting miR-1246 expression in healthy controls’ B cells increases CD40, CD80, and CD86 expression and enhances B cell responsiveness. All panels, normal B cells were transfected with miR-1246 inhibitor or inhibitor control. Transfected cells were stained with PE-Cy7-conjugated anti-human CD40, FITC-conjugated anti-human CD80, PerCP-Cy5.5-conjugated anti-human CD86, and APC-conjugated anti-human CD19 and analyzed by flow cytometry, percentage (A), and mean fluorescence intensity (MFI) (B) for CD40, CD80, and CD86 in normal B cells inhibiting miR-1246 and in inhibitor controls (*P < 0.05). (C, D) Overexpression of miR-1246 in SLE B cells decreases CD40, CD80, and CD86 expression and reduces B cell responsiveness. All panels, SLE B cells were transfected with miR-1246 mimic or mimic control. Transfected cells were stained with PE-Cy7-conjugated anti-human CD40, FITC-conjugated anti-human CD80, PerCP-Cy5.5-conjugated anti-human CD86, and APC-conjugated anti-human CD19 and analyzed by flow cytometry, percentage (C), and MFI (D) for CD40, CD80, and CD86 in SLE B cells overexpressing miR-1246 and in mimic controls (*P < 0.05). All data represent the mean ± SD results of three independent experiments. All experiments were performed in triplicate.
Figure 5
Figure 5
The relationship between B cell activity and miR-1246. (A) Measurement of miR-1246 level after stimulated with anti-IgM and anti-CD40 antibodies or PBS (control) in normal B cells. (B, C) Representative Western blotting results and densitometric analysis for early B cell factor 1 (EBF1) protein level, AKT phosphorylation, and P53 protein level in normal B cells after stimulated with anti-IgM and anti-CD40 antibodies and PBS (control). (D, E) Percentage (D) and mean fluorescence intensity (MFI) (E) of CD40, CD80, and CD86 in normal B cells stimulated with anti-IgM, anti-CD40, and PBS (control). Data are presented as the mean ± SD of the same experiments performed in three healthy donors. (*P < 0.05; **P < 0.01).
Figure 6
Figure 6
The relationship between B cell activity and miR-1246. (A-E) MiR-1246 expression (A), early B cell factor 1 (EBF1) protein level, AKT phosphorylation and P53 protein level (B, C), percentage (D), and mean fluorescence intensity (MFI) (E) of CD40, CD80, and CD86 in stimulated B cell transfected with miR-1246 mimic and mimic control. CD4+T cells which were isolated from the same healthy control were cultured in RPMI 1640 medium with 10% FBS, 100 U/ml penicillin G, and streptomycin. After stimulation and transfection, B cells were co-cultured with autologous CD4+T cells at a ratio of 4:1 in 96-well round-bottomed plates. At 24 h, percentage (F) and MFI (G) of CD40L, CD28, and CD152 were measured by flow cytometry. The Western blot image is a representative image. Data are presented as the mean ± SD of the same experiments performed in three healthy donors. (*P < 0.05; **P < 0.01).
Figure 7
Figure 7
The relationship between B cell activity and miR-1246. We treated three healthy B cells with PBS, anti-IgM and anti-CD40 antibodies, or AKT inhibitor pre-treated + anti-IgM and anti-CD40 antibodies. (A-C) Increased AKT protein phosphorylation and decreased P53 protein and miR-1246 expression in anti-IgM and anti-CD40 antibodies-treated healthy B cells, compared with PBS-treated healthy B cells. Decreased AKT protein phosphorylation and increased P53 protein and miR-1246 expression in pre-treated AKT inhibitor + anti-IgM and anti-CD40 antibodies-treated healthy B cells compared with anti-IgM and anti-CD40 antibodies-treated healthy B cells. The Western blot image is a representative image. Data are presented as the mean ± SD of the same experiments performed in three healthy donors. (*P < 0.05; **P < 0.01).
Figure 8
Figure 8
The regulation of miR-1246 expression by AKT-P53 signaling pathway in B cells from systemic lupus erythematosus (SLE) patients. (A, B) AKT phosphorylation was markedly increased, but no difference in AKT protein expression (A, C), while P53 protein level was sharply downregulated (B, D) in B cells from active SLE patients compared to healthy controls. AKT phosphorylation levels were negatively correlated with P53 protein expression levels (E) while P53 protein levels were positively correlated with miR-1246 expression levels in B cells from active SLE patients (F). The Western blot images are representative images (n = 4). Bars in (C) and (D) show the mean ± SD results in 20 healthy donors and 30 active patients with SLE. (*P < 0.05).
Figure 9
Figure 9
The regulation of miR-1246 expression by AKT-P53 signaling pathway in B cells from SLE patients. AKT protein phosphorylation, P53 protein levels, and miR-1246 expression were detected in AKT inhibitor-treated SLE B cells compared with PBS-treated SLE B cells. (A-C) AKT phosphorylation was markedly decreased, while P53 protein level and miR-1246 expression were sharply upregulated in AKT inhibitor-treated SLE B cells compared with PBS-treated SLE B cells. The Western blot image is a representative image. Data are presented as the mean ± SD of the same experiments performed in three active SLE patients. (**P < 0.01).

Similar articles

Cited by

References

    1. Frieri M. Mechanisms of disease for the clinician: systemic lupus erythematosus. Ann Allergy Asthma Immunol. 2013;110:228–32. doi: 10.1016/j.anai.2012.12.010. - DOI - PubMed
    1. Javierre BM, Richardson B. A new epigenetic challenge: systemic lupus erythematosus. Adv Exp Med Biol. 2011;711:117–36. doi: 10.1007/978-1-4419-8216-2_9. - DOI - PubMed
    1. Mak A, Tay SH. Environmental factors, toxicants and systemic lupus erythematosus. Int J Mol Sci. 2014;15:16043–56. doi: 10.3390/ijms150916043. - DOI - PMC - PubMed
    1. Rekvig OP, Van der Vlag J. The pathogenesis and diagnosis of systemic lupus erythematosus: still not resolved. Semin Immunopathol. 2014;36:301–11. doi: 10.1007/s00281-014-0428-6. - DOI - PubMed
    1. Liu A, La Cava A. Epigenetic dysregulation in systemic lupus erythematosus. Autoimmunity. 2014;47:215–9. doi: 10.3109/08916934.2013.844794. - DOI - PubMed