. 2015 Mar 17;15(3):6419-40.
doi: 10.3390/s150306419.

Stride segmentation during free walk movements using multi-dimensional subsequence dynamic time warping on inertial sensor data

Affiliations

Stride segmentation during free walk movements using multi-dimensional subsequence dynamic time warping on inertial sensor data

Jens Barth et al. Sensors (Basel). .

Abstract

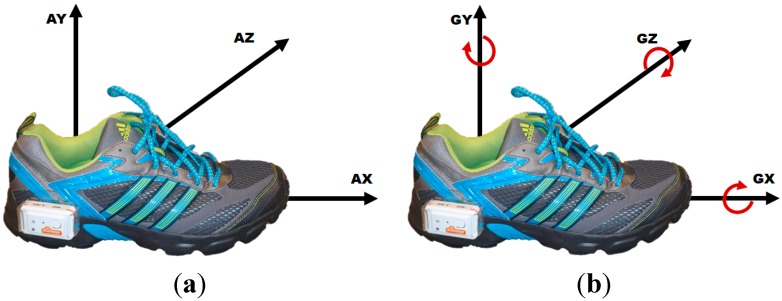
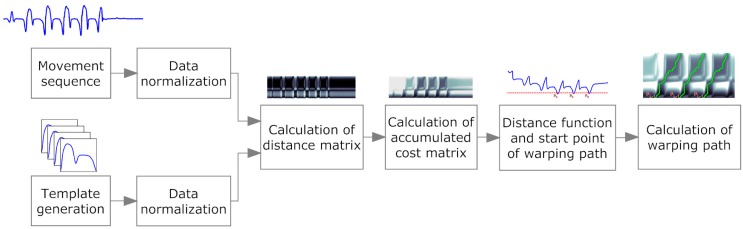
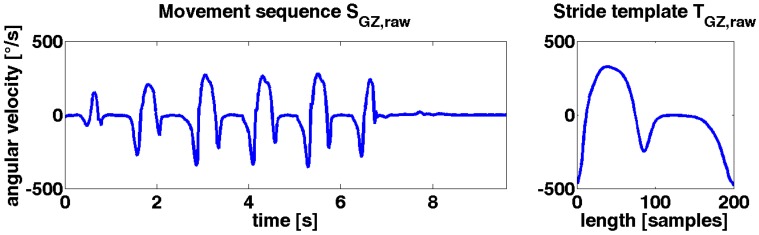
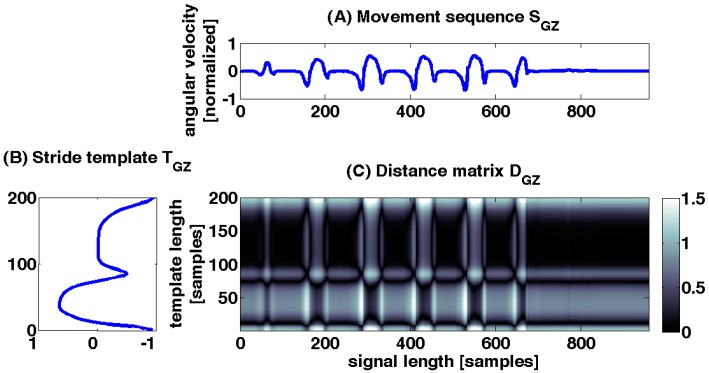
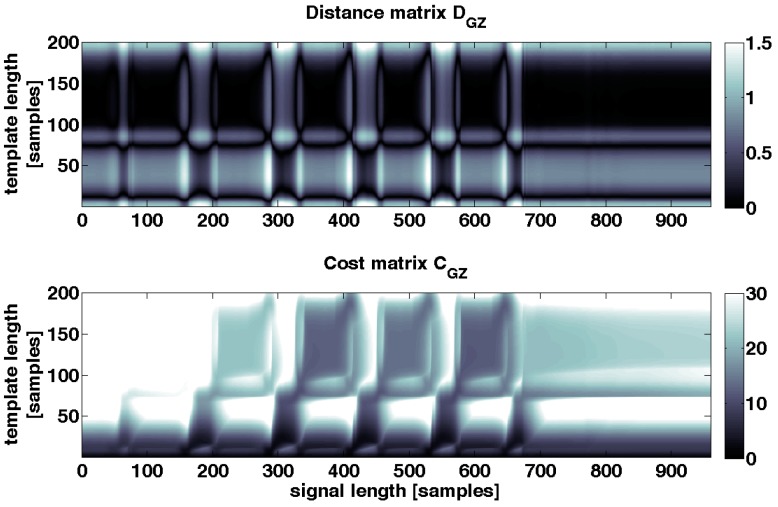
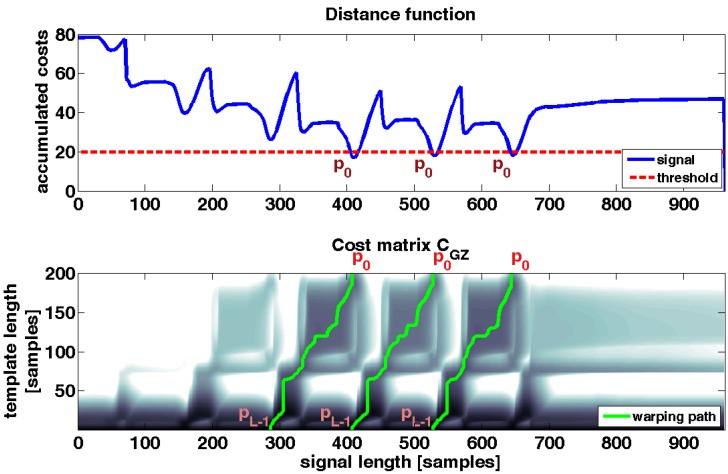
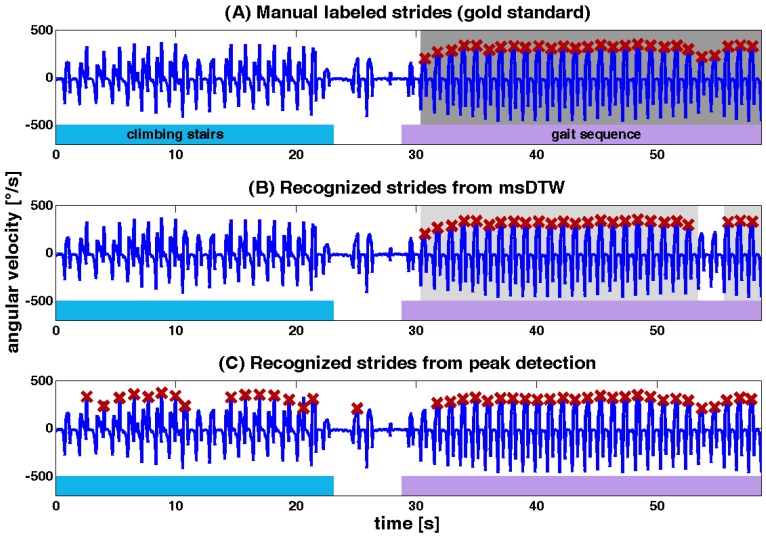
Changes in gait patterns provide important information about individuals' health. To perform sensor based gait analysis, it is crucial to develop methodologies to automatically segment single strides from continuous movement sequences. In this study we developed an algorithm based on time-invariant template matching to isolate strides from inertial sensor signals. Shoe-mounted gyroscopes and accelerometers were used to record gait data from 40 elderly controls, 15 patients with Parkinson's disease and 15 geriatric patients. Each stride was manually labeled from a straight 40 m walk test and from a video monitored free walk sequence. A multi-dimensional subsequence Dynamic Time Warping (msDTW) approach was used to search for patterns matching a pre-defined stride template constructed from 25 elderly controls. F-measure of 98% (recall 98%, precision 98%) for 40 m walk tests and of 97% (recall 97%, precision 97%) for free walk tests were obtained for the three groups. Compared to conventional peak detection methods up to 15% F-measure improvement was shown. The msDTW proved to be robust for segmenting strides from both standardized gait tests and free walks. This approach may serve as a platform for individualized stride segmentation during activities of daily living.


Figures

Figure 1
Figure 1
Shimmer sensor unit mounted with custom designed clip on the lateral side of a regular sport shoe. The directions of the sensor axes are shown accordingly to the sensor placement on the shoe. (a) Accelerometer; (b) Gyroscope.
Figure 2
Figure 2
Typical sensor signals of four strides from a straight walk of an elderly control. Left column shows accelerometer signals from movements in (A) anterior-posterio; (B) inferior-superior and (C) lateral-medial direction. Right column shows gyroscope angular velocities of the rotations in (D) coronal, (E) transverse and (F) sagittal plane.
Figure 3
Figure 3
Illustration of the signal processing workflow for the msDTW algorithm, related to the organization of Subsection 2.4.2, Subsection 2.4.3, Subsection 2.4.4 and Subsection 2.4.5. The normalized movement sequence, from which the strides are extracted, and the normalized stride template were used to create a distance matrix. This matrix includes the distance between each sample of the stride template and each sample of the movement sequence. From this matrix, an accumulated cost matrix was generated that represents the costs of warping the stride template to the movement sequence. A path through this cost matrix with minimum costs represents a nonlinear warping of the template to a part of the movement sequence. Low costs indicate parts in the movement sequences that are very similar to the template. The start point of a warping path is identified in the distance function.
Figure 4
Figure 4
Left: the movement sequence SGz,raw shows a typical angular velocity representation of a gait sequence in the sagittal plane (GZ); Right: the stride template TGz,raw shows the template of the corresponding axis.
Figure 5
Figure 5
Distance matrix DGZ is shown as an example for one sensor axis which is calculated from SGZ and TGZ. Distance matrix was calculated from gyroscope angular velocity in sagittal plane (GZ). Deep black values in the distance matrix DGZ show less distance and higher similarity between SGZ and TGZ. White values signalize a high distance and consequently high costs. (A) movement sequence SGZ; (B) stride template TGZ; (C) distance matrix DGZ;
Figure 6
Figure 6
Upper: example distance matrix DGZ for one axis, which is also shown in Figure 5; Below: cost matrix CGZ which is calculated from DGZ. Deep black values in DGZ and CGZ show less distance and low costs between SGZ and TGZ. White values signalize a high distance and high costs. A path of deep black values from top to bottom signalizes a good warping of stride template T to movement sequence S.
Figure 7
Figure 7
Upper: distance function ΔGZ which is the top row of cost matrix CGZ. Below: cost matrix CGZ. In the plot of the distance function also the threshold and three local minima are illustrated. These minima are the start points of the warping paths p. The plot of the cost matrix CGZ is overlaid with three warping paths p which correspond to three segmented strides in the movement sequence SGZ.
Figure 8
Figure 8
Excerpt of a typical gait signal from free walk of an elderly control. The subject climbed stairs for the first 20 s, which was followed by a transition to a straight walking episode. In the upper plot (A) manually labeled strides were marked with red crosses and the complete gait sequence in dark grey. The middle plot (B) shows the result from msDTW with recognized strides marked with red crosses and segmented gait sequence marked in grey. Lower plot (C) shows marked strides from peak detection algorithm. Only stride maxima were marked with red crosses, because peak detection only detects the peaks, not the complete gait sequence. Bottom plot also shows typical mistakes from the peak detection algorithm, where stair climbing strides by mistake were marked as strides.

References

    1. Klucken J., Barth J., Kugler P., Schlachetzki J., Henze T., Marxreiter F., Kohl Z., Steidl R., Hornegger J., Eskofier B., et al. Unbiased and mobile gait analysis detects motor impairment in parkinson’s disease. PLoS One. 2013;8:e56956. doi: 10.1371/journal.pone.0056956. - DOI - PMC - PubMed
    1. Mariani B., Hoskovec C., Rochat S., Büla C., Penders J., Aminian K. 3D gait assessment in young and elderly subjects using foot-worn inertial sensors. J. Biomech. 2010;43:2999–3006. doi: 10.1016/j.jbiomech.2010.07.003. - DOI - PubMed
    1. Salarian A., Russmann H., Vingerhoets F.J.G., Dehollain C., Blanc Y., Burkhard P.R., Aminian K. Gait Assessment in Parkinson’s Disease: Toward an Ambulatory System for Long-Term Monitoring. IEEE Trans. Biomed. Eng. 2004;51:1434–1443. doi: 10.1109/TBME.2004.827933. - DOI - PubMed
    1. Selles R.W., Formanoy M.A.G., Bussmann J.B.J., Janssens P.J., Stam H.J. Automated estimation of initial and terminal contact timing using accelerometers; development and validation in transtibial amputees and controls. IEEE Trans. Neural Syst. Rehabil. Eng. 2005;13:81–88. doi: 10.1109/TNSRE.2004.843176. - DOI - PubMed
    1. Derawi M.O., Bours P., Holien K. Improved cycle detection for accelerometer based gait authentication; Proceedings of the Sixth International Conference on Intelligent Information Hiding and Multimedia Signal Processing; Darmstadt, Germany. 15–17 October 2010; pp. 312–317.