. 2015 Mar 18;85(6):1289-304.
doi: 10.1016/j.neuron.2015.02.028.

Targeted ablation, silencing, and activation establish glycinergic dorsal horn neurons as key components of a spinal gate for pain and itch

Affiliations

Targeted ablation, silencing, and activation establish glycinergic dorsal horn neurons as key components of a spinal gate for pain and itch

Edmund Foster et al. Neuron. .

Abstract

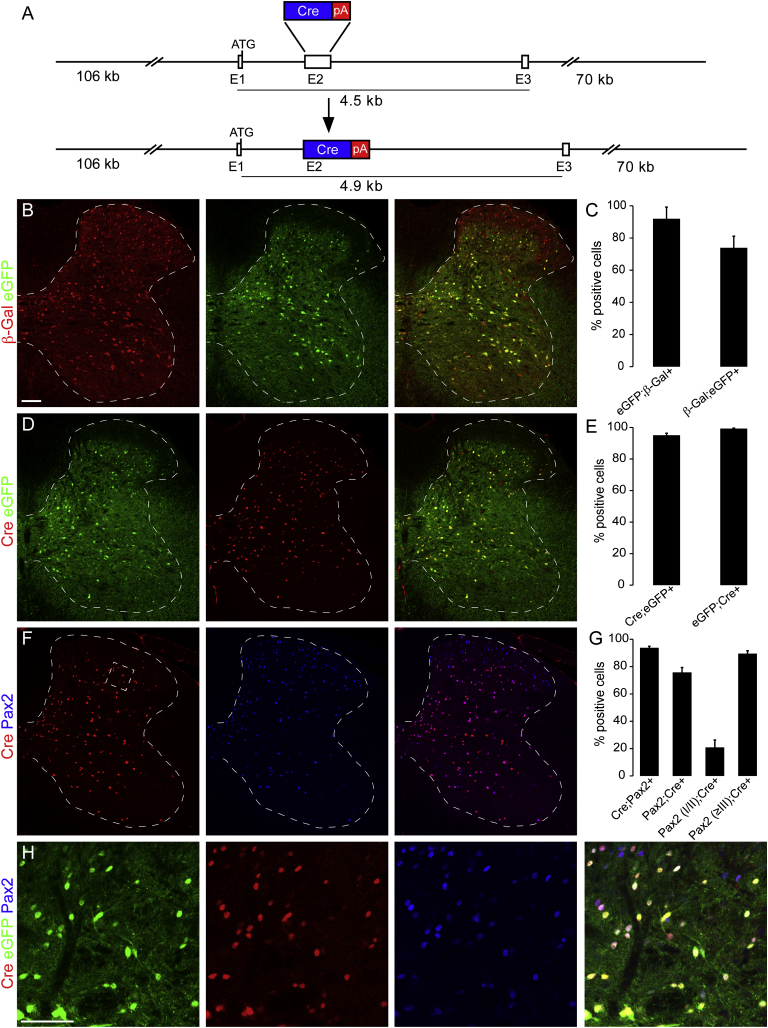
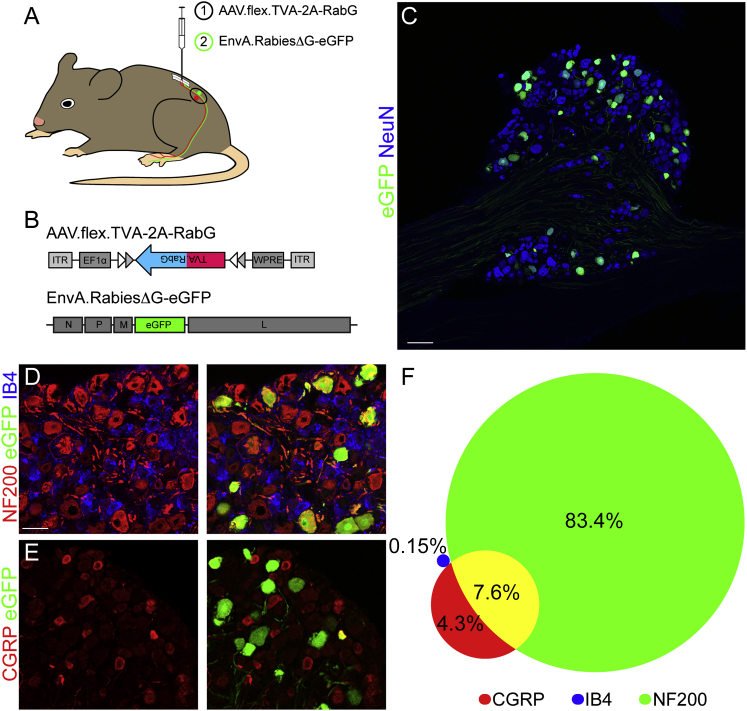
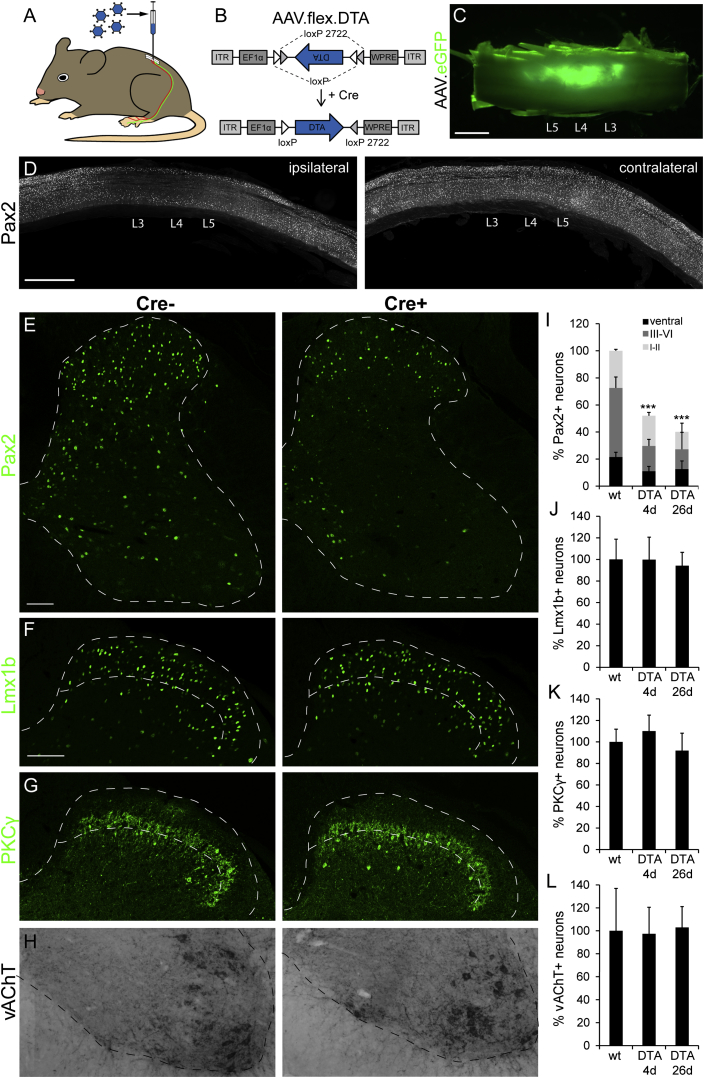
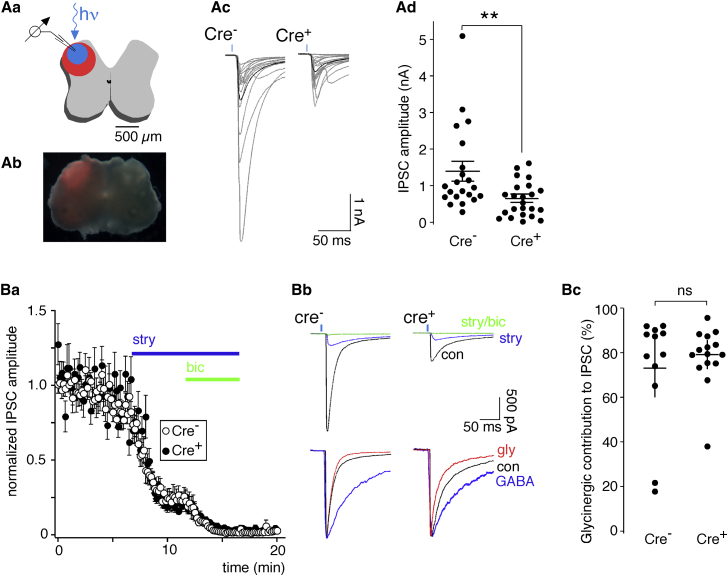
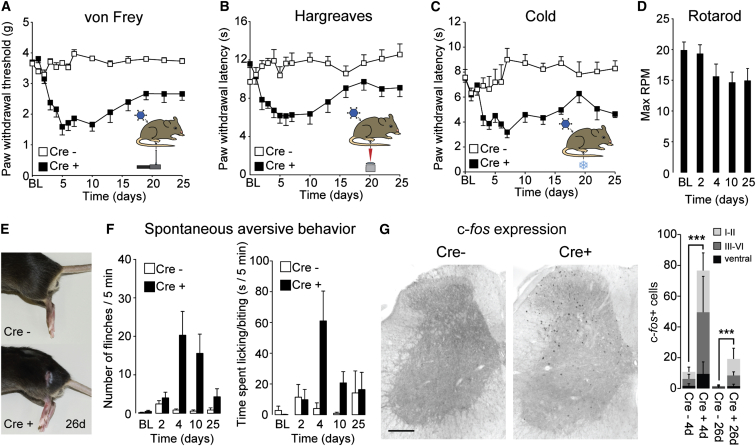
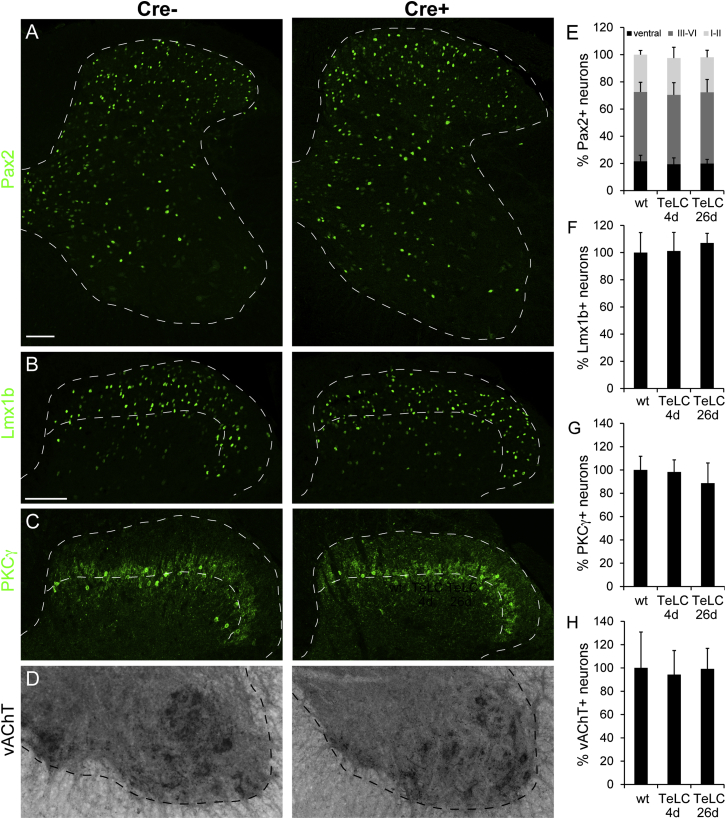
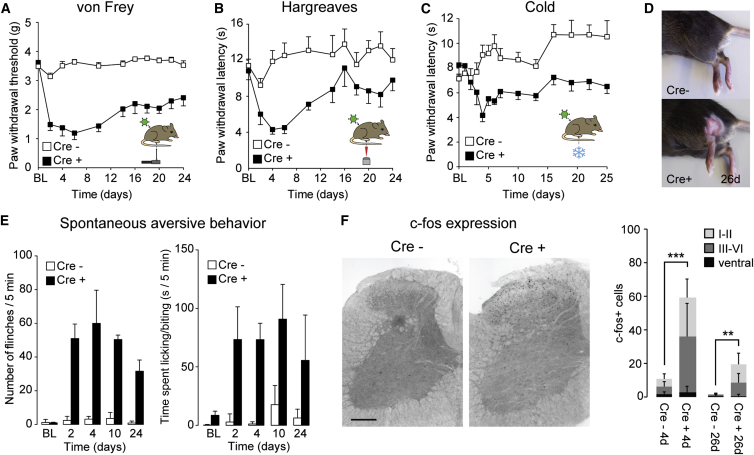
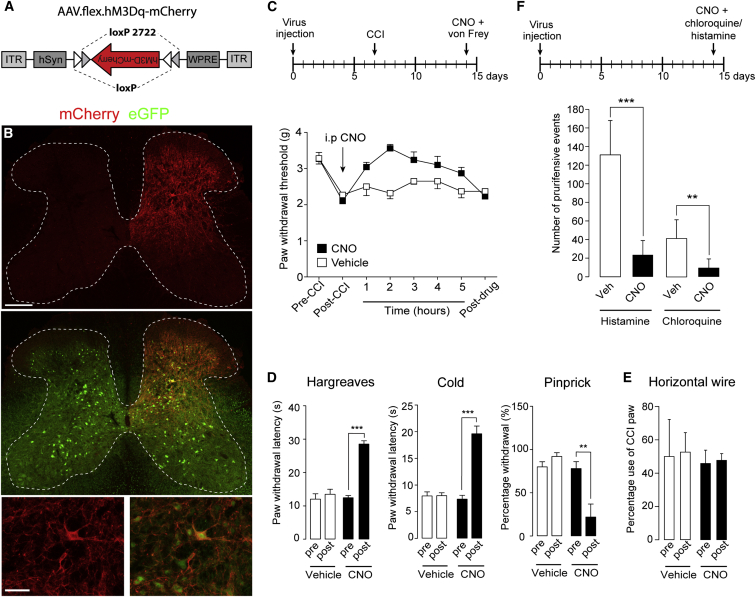
The gate control theory of pain proposes that inhibitory neurons of the spinal dorsal horn exert critical control over the relay of nociceptive signals to higher brain areas. Here we investigated how the glycinergic subpopulation of these neurons contributes to modality-specific pain and itch processing. We generated a GlyT2::Cre transgenic mouse line suitable for virus-mediated retrograde tracing studies and for spatially precise ablation, silencing, and activation of glycinergic neurons. We found that these neurons receive sensory input mainly from myelinated primary sensory neurons and that their local toxin-mediated ablation or silencing induces localized mechanical, heat, and cold hyperalgesia; spontaneous flinching behavior; and excessive licking and biting directed toward the corresponding skin territory. Conversely, local pharmacogenetic activation of the same neurons alleviated neuropathic hyperalgesia and chloroquine- and histamine-induced itch. These results establish glycinergic neurons of the spinal dorsal horn as key elements of an inhibitory pain and itch control circuit.


Figures

Figure 1
Figure 1
Generation and Characterization of GlyT2::Cre BAC Transgenic Mice (A) GlyT2::Cre BAC transgenic mice were generated from a BAC DNA clone containing the mouse GlyT2 locus, of which exon 2 (E2) was modified by the insertion of a Cre expression cassette. (B) Comparison of Cre-mediated recombination and GlyT2::eGFP expression in GlyT2::Cre;GlyT2::eGFP;Rosa26LacZ triple-transgenic mice using anti-β-gal (red) and anti-eGFP (green) antibodies. (C) Percentage of β-gal and eGFP double-positive neurons (mean ± SD). (D) Same as (B) but analysis of co-expression of Cre with eGFP. (E) Quantification of (D). (F) Same as (B) but analysis of co-expression of Cre with Pax2. (G) Quantification of (F). The two left columns refer to the entire spinal cord cross section (laminae I–X), whereas the two right columns show results for the superficial dorsal horn (laminae I/II) and the rest of the spinal cord (≥III) separately. (H) Higher magnification of the lamina II/III border (the dashed area indicated in F). Scale bars, 100 μm (B) and 50 μm (F).
Figure 2
Figure 2
Innervation of Spinal Glycinergic Neurons by Primary Sensory Neurons (A) Schematic of the injection paradigm enabling monosynaptic retrograde tracing from GlyT2::Cre+ spinal neurons. A Cre-dependent AAV coding for the avian sarcoma virus receptor and the rabies G protein (AAV.flex.TVA-2A-RabG, (1)) was injected 14 days prior to injection with an EnvA-pseudotyped G-deleted eGFP rabies virus (EnvA.RabiesΔG-eGFP, (2)). (B) Schematic of the genomes of the AAV and rabies virus used in this experiment. (C) A section of a DRG containing numerous retrogradely infected neurons was stained with antibodies against NeuN (blue) and eGFP (green). (D and E) Immunohistological analysis of retrogradely infected DRG neurons. Shown are NF200 (red), eGFP (green), and IB4 (blue) (D) or antibodies against eGFP (green) and CGRP (red). (F) Relative abundance of NF200+, CGRP+, or IB4+ cells among the eGFP+ (retrogradely infected) population of DRG neurons. Eight mice were analyzed. Scale bars, 100 μm (C) and 50 μm (D).
Figure 3
Figure 3
Specific Loss of Inhibitory Interneurons after AAV.flex.DTA Injection into the Dorsal Horn of GlyT2::Cre+ Mice (A) AAV.flex.DTA was injected into the lumbar dorsal horn of GlyT2::Cre+ GlyT2::Cre− littermates. (B) The AAV.flex.DTA genome. The expression of DTA is driven by the EF1a promotor (EF1a) and depends on Cre-mediated irreversible inversion of the DTA coding sequence. (C) Green fluorescence illustrates virus spread (of an AAV.eGFP) following three separate unilateral injections into the lumbar spinal cord at levels L3–L5. (D) Sagittal sections of a spinal cord after injection of AAV.flex.DTA illustrate a marked reduction in the number of Pax2+ cells on the ipsilateral side (left) but not on the contralateral side (right). (E) Compared with AAV.flex.DTA-injected GlyT2::Cre− control mice, a clear loss of Pax2+ cells was observed 4 days after injection of AAV.flex.DTA on the injected side of GlyT2::Cre+ mice. Fluorescence signals detected by confocal microscopy were false-colored in green. (F–H) Same as (E) but analysis of Lmx1b+ excitatory dorsal horn neurons (F), PKCγ+ excitatory dorsal horn neurons (G), and vAChT+ motoneurons (H). (I–L) Quantification (mean ± SD). At least three to four horizontal sections per mouse centered around the L4 injection site were used for quantification. (I) ∗∗∗p < 0.001 versus baseline, one-way ANOVA, F(2,33) = 59.1, followed by Bonferroni post hoc test. (I–K) No significant differences in cell counts were found for Lmx1b+, PKCγ+, or vAChT+ neurons (p > 0.20). Dashed lines indicate gray matter border (E–H) and borders of lamina II (F and G). Scale bars, 1 mm (C and D) and 100 μm (E and H).
Figure 4
Figure 4
Inhibitory Synaptic Transmission after Local Glycinergic Interneuron Ablation (Aa–Ad) IPSCs evoked by 4-ms, 473-nm light stimulation recorded in slices prepared from mice 4 days after AAV.flex.DTA injection. (Aa) Schematic illustrating the recording situation. (Ab) Distribution of mCherry expression observed after unilateral injection of AAV.mCherry together with the AAV.flex.DTA. (Ac) Average IPSC traces per cell (gray) of 21 neurons from GlyT2::Cre− (left) and 23 neurons from GlyT2::Cre+ mice (right). Black traces represent the average IPSC for each genotype. (Ad) Statistics. Dots represent average IPSC amplitudes of individual cells. Horizontal and vertical lines indicate mean values and SEM. ∗∗p < 0.01 (unpaired t test). (Ba–Bc) Contribution of glycine and GABA to the IPSC amplitude in AAV.flex.DTA-injected GlyT2::Cre+ and GlyT2::Cre− mice. (Ba) Time course of the experiment. Strychnine (stry, 0.5 μM) and a combination of strychnine (0.5 μM) and bicuculline (bic, 20 μM) were applied 6 and 12 min after the recording started. (Bb) The top traces show averages of 10 consecutive traces recorded under control conditions during application of strychnine and in the combined presence of strychnine and bicuculline. The normalized traces below illustrate the difference in the decay kinetics of the GABAergic and glycinergic IPSC components. (Bc) Statistics. Dots represent the glycinergic IPSC component in individual cells. Horizontal and vertical lines indicate mean values and SEM, p = 0.49 (unpaired t test), n = 12 and 15 for GlyT2::Cre- and GlyT2::Cre+ mice, respectively.
Figure 5
Figure 5
Mechanical, Heat, and Cold Hyperalgesia and Spontaneous Aversive Behaviors Induced after Local Ablation of Glycinergic Dorsal Horn Neurons (A) Reduction in mechanical PWT (mean ± SEM) over time after unilateral injection of AAV.flex.DTA into GlyT2::Cre+ mice and GlyT2::Cre− littermates. Two-way repeated measures ANOVA revealed a significant time x genotype interaction (F(13,221) = 13.9, p < 0.001), and post hoc comparisons show significant differences between genotypes at 3–25 days (p < 0.01, n = 11 and 8 for GlyT2::Cre+ and GlyT2::Cre− mice, respectively). baseline. (B) Heat hyperalgesia. Two-way repeated measures ANOVA revealed a significant time x genotype interaction (F(13,221) = 4.04, p < 0.001). Significant differences between genotypes were found for time points 3–10 days (p < 0.01, n = 11 and 8 for GlyT2::Cre+ and GlyT2::Cre− mice, respectively). (C) Cold hyperalgesia. Two-way repeated measures ANOVA revealed a significant time x genotype interaction (F(13,143) = 2.81, p = 0.001). Significant differences were found between genotypes for time points 7–16 days (p < 0.01, n = 6 and 7 for GlyT2::Cre+ and GlyT2::Cre− mice, respectively). (D) Accelerating rotarod performance (maximum tolerated rounds per minute [RPM]). Repeated measures ANOVA, F(4,40) = 4.14; p = 0.007 (n = 11). Post hoc LSD test revealed a significant change from the baseline for day 25 only. (E) GlyT2::Cre+ mice, but not GlyT2::Cre− littermates, exhibited localized hair loss on the thigh ipsilateral to the virus injection (depicted here 26 days after virus injection). (F) Spontaneous aversive behaviors (flinches, left, and time spent licking/biting, right) in GlyT2::Cre+ mice and GlyT2::Cre− littermates (n = 7 each). Two-way repeated measures ANOVA revealed a significant time x genotype interaction for flinching (F(4,48) = 7.02, p < 0.001), and time spent licking/biting (F(4,48) = 7.02, p < 0.001). Significant differences between genotypes were found for days 4 and 10 (p ≤ 0.01 for both readouts). On day 25, the number of flinches and the time spent licking/biting were reduced significantly compared with day 4 (p < 0.05). (G) c-fos expression in spinal cords of GlyT2::Cre+ mice and GlyT2::Cre− littermates 4 days after dorsal horn AAV.flex.DTA injection. ∗∗∗p < 0.001, unpaired t test, n ≥ 9 sections from 3-4 different animals. Scale bar, 200 μm. Error bars indicate SEM in (A–D) and (F) and SD in (G).
Figure 6
Figure 6
Expression of Tetanus Toxin Light Chain in Glycinergic Dorsal Horn Interneurons Does Not Cause Neuronal Death (A) No loss of Pax2 immunoreactive cells following AAV.flex.TeLC injection into GlyT2::Cre+ mice (images taken 4 days after virus injection). (B–D) No apparent loss of Lmx1b+ excitatory dorsal horn neurons (B), of PKCγ+ excitatory dorsal horn neurons (C), or of vAChT+ motoneurons (D) was detected. (E–H) Quantifications (percent relative to GlyT2::Cre−, mean ± SD). Scale bars, 100 μm (A and B).
Figure 7
Figure 7
Local Silencing with Tetanus Toxin Light Chain of Glycinergic Dorsal Horn Neurons Recapitulates the Behavioral Effects of Diphtheria Toxin-Mediated Ablation (A) Mechanical hyperalgesia. Statistics: significant time x genotype interaction, F(10,140) = 12.4, p < 0.001 (two-way repeated measures ANOVA). Post hoc comparisons show significant differences between genotypes at 2–24 days (p < 0.01, n = 8 for both genotypes). (B) Heat hyperalgesia: significant time x genotype interaction (F(10,140) = 42.35, p < 0.05). Significant differences between genotypes were found for time points 4–10 days (p < 0.01, n = 8 for both genotypes). (C) Same as (B) but cold hyperalgesia. Repeated measures ANOVA (F(13,247) = 4.0, p < 0.001). Significant differences between genotypes were found (p ≤ 0.01) for time points 4–16 days (n = 10 and 11 for GlyT2::Cre+ and GlyT2::Cre− mice, respectively). (D) Localized hair removal and skin lesions (26 days after AAV.flex.TeLC injection). (E) Spontaneous aversive behaviors (n = 5 and 6 for GlyT2::Cre+ and Cre− mice, respectively). ANOVA revealed significant differences for between subject effect (genotype) (F(1,9) = 48.3, p < 0.001 and F(1,9) = 76.3 p < 0.001 for flinching and licking/biting, respectively). (F) c-fos expression (images taken 4 days after AAV.flex.TeLC injection). ∗∗∗p < 0.001; ∗∗p < 0.01, unpaired t test comparing the total number of c-fos+ cells from all laminae, n = 4–7. For more details, see Figure 5. Error bars indicate SEM in (A–C) and (E) and SD in (F). Scale bar, 200 μm.
Figure 8
Figure 8
Pharmacogenetic Activation of Spinal Glycinergic Neurons Ameliorates CCI-Induced Neuropathic Pain and Chloroquine- or Histamine-Induced Itch (A) Diagram illustrating the AAV genome containing the flex.hM3Dq-mCherry cassette. (B) Expression of hM3Dq in the spinal cord of GlyT2::Cre;GlyT2::eGFP double-transgenic mice is indicated by mCherry fluorescence. Expression is limited to the ipsilateral dorsal horn and is present in somata (see detail, bottom) and neurites of eGFP+ neurons. Scale bars, 200 μm (top) and 50 μm (bottom). (C) Antihyperalgesic effects. All experiments were made in GlyT2::Cre+ mice. AAV.flex.hM3Dq-mCherry was injected at day 0, CCI surgery was performed on day 7 on virus-injected mice, and vehicle or CNO (1 mg/kg, i.p.) was injected on day 14. Mechanical PWTs (g) were assessed using electronic von Frey filaments before CCI surgery (pre-CCI), after CCI surgery immediately before CNO/vehicle injection (post-CCI), for 5 hr after CNO/vehicle injection, and 1 day later (post-drug). Repeated measures ANOVA, F(6,66) = 4.47; p = 0.001 for treatment x time interaction. Post hoc comparisons revealed significant differences between CNO and vehicle-treated groups for time points 2 and 3 hr (n = 6 and 7 for vehicle and CNO, respectively). (D) Acute antinociceptive effects (repeated-measures ANOVA). Significant treatment effects were observed in the Hargreaves test (F(1,9) = 43.1, p < 0.001 [n = 5 and 6 for CNO and vehicle, respectively]), for cold hyperalgesia (F(1,9) = 56.2, p < 0.001 [n = 6 and 5]), and for pinprick stimulation (F(1,8) = 21.0, p = 0.002 [n = 5 each]). (E) Horizontal wire test. Repeated measures ANOVA (F(1,7) = 0.001, p = 0.98). (F) Blockade of chloroquine- and histamine-induced itch in AAV.flex.hM3Dq-mCherry-injected GlyT2::Cre+ mice by CNO. ∗∗∗p < 0.001; ∗∗p < 0.01, unpaired t test, n = 7 for all four groups. All error bars indicate SEM.

Comment in

References

    1. Ahmadi S., Lippross S., Neuhuber W.L., Zeilhofer H.U. PGE2 selectively blocks inhibitory glycinergic neurotransmission onto rat superficial dorsal horn neurons. Nat. Neurosci. 2002;5:34–40. - PubMed
    1. Akiyama T., Carstens E. Neural processing of itch. Neuroscience. 2013;250:697–714. - PMC - PubMed
    1. Alexander G.M., Rogan S.C., Abbas A.I., Armbruster B.N., Pei Y., Allen J.A., Nonneman R.J., Hartmann J., Moy S.S., Nicolelis M.A. Remote control of neuronal activity in transgenic mice expressing evolved G protein-coupled receptors. Neuron. 2009;63:27–39. - PMC - PubMed
    1. Armbruster B.N., Li X., Pausch M.H., Herlitze S., Roth B.L. Evolving the lock to fit the key to create a family of G protein-coupled receptors potently activated by an inert ligand. Proc. Natl. Acad. Sci. USA. 2007;104:5163–5168. - PMC - PubMed
    1. Aschauer D.F., Kreuz S., Rumpel S. Analysis of transduction efficiency, tropism and axonal transport of AAV serotypes 1, 2, 5, 6, 8 and 9 in the mouse brain. PLoS ONE. 2013;8:e76310. - PMC - PubMed

Publication types

MeSH terms