. 2015 Mar 19;10(3):e0119888.
doi: 10.1371/journal.pone.0119888. eCollection 2015.

Liver inflammation and metabolic signaling in ApcMin/+ mice: the role of cachexia progression

Affiliations

Liver inflammation and metabolic signaling in ApcMin/+ mice: the role of cachexia progression

Aditi A Narsale et al. PLoS One. .

Abstract

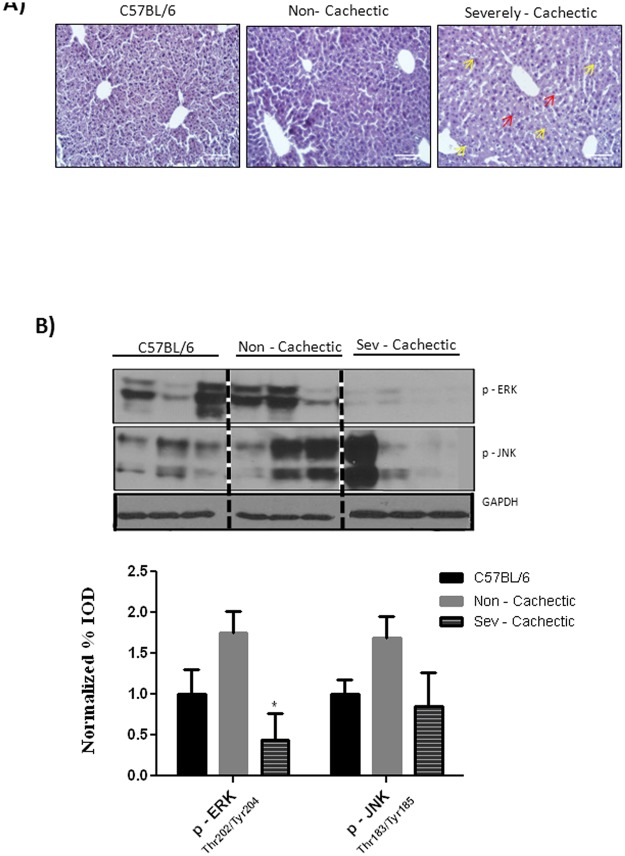
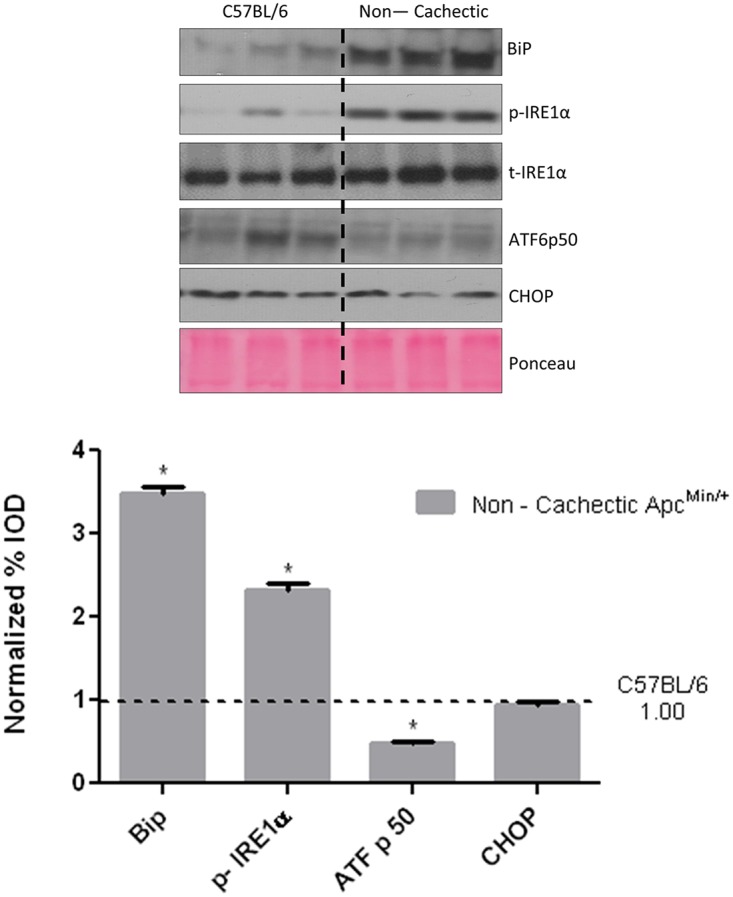
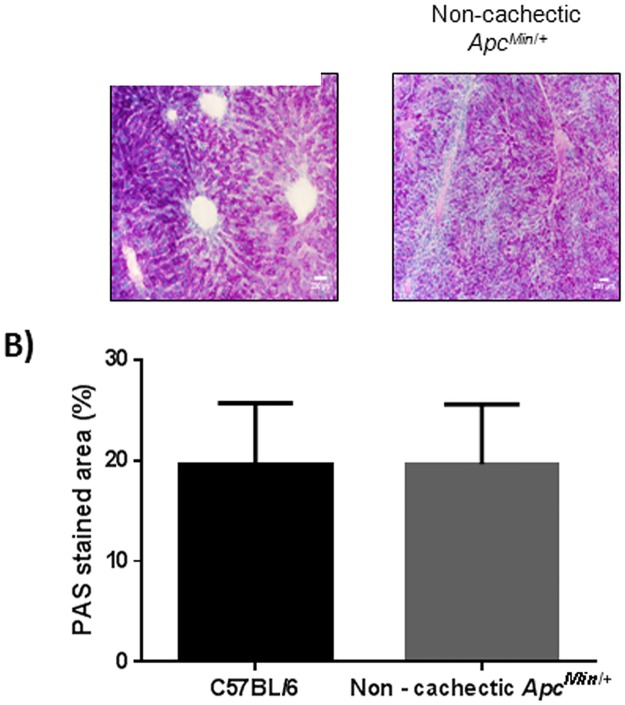
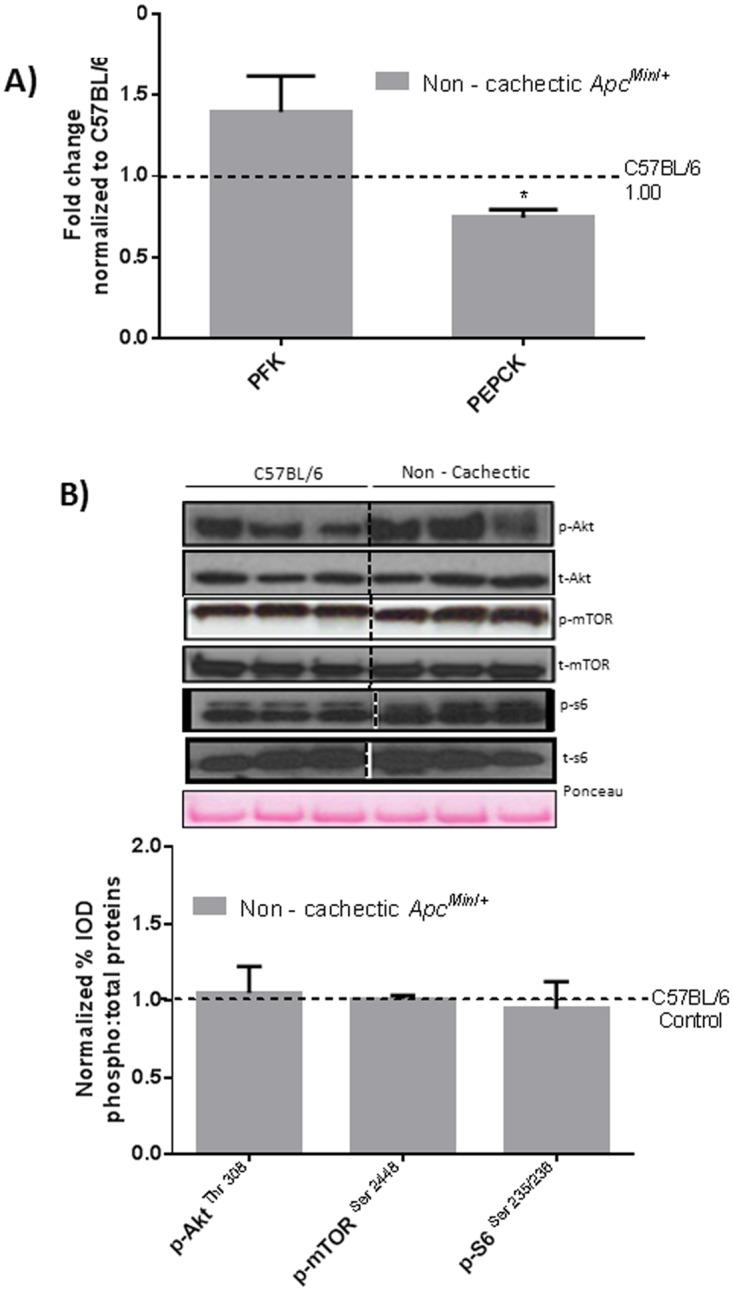
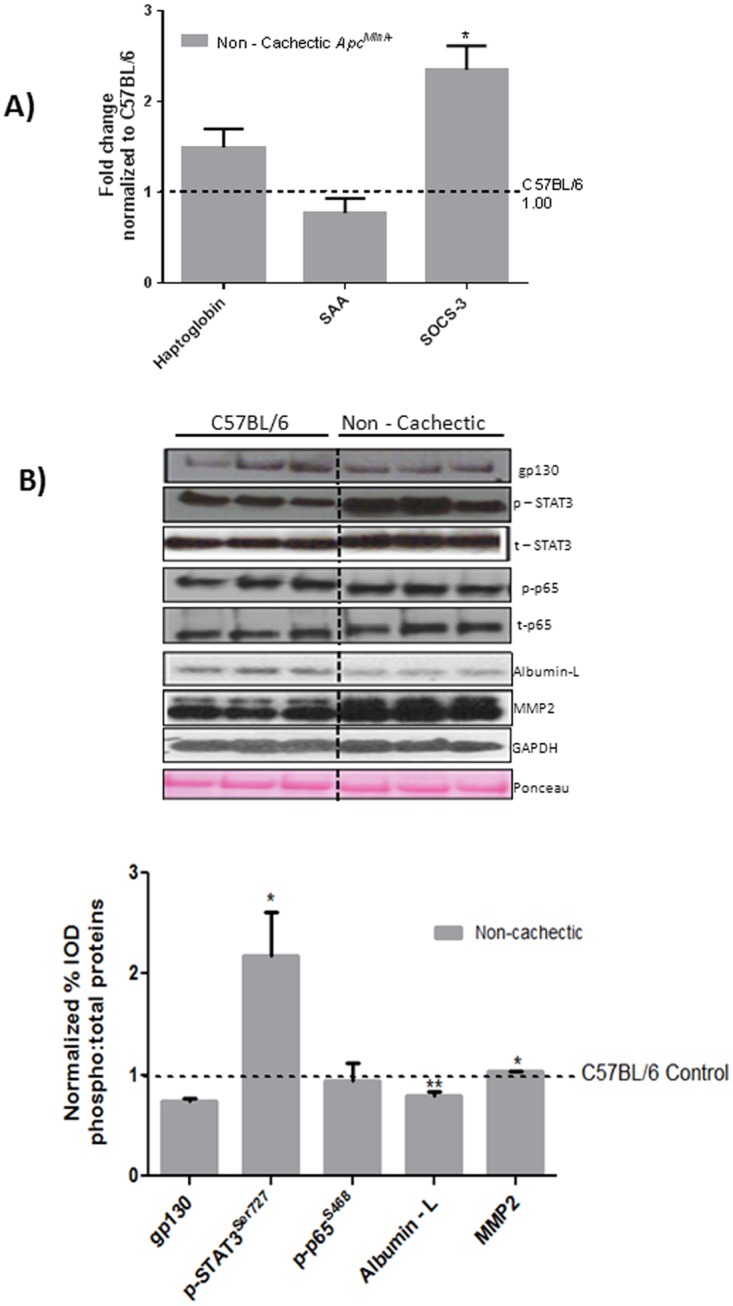
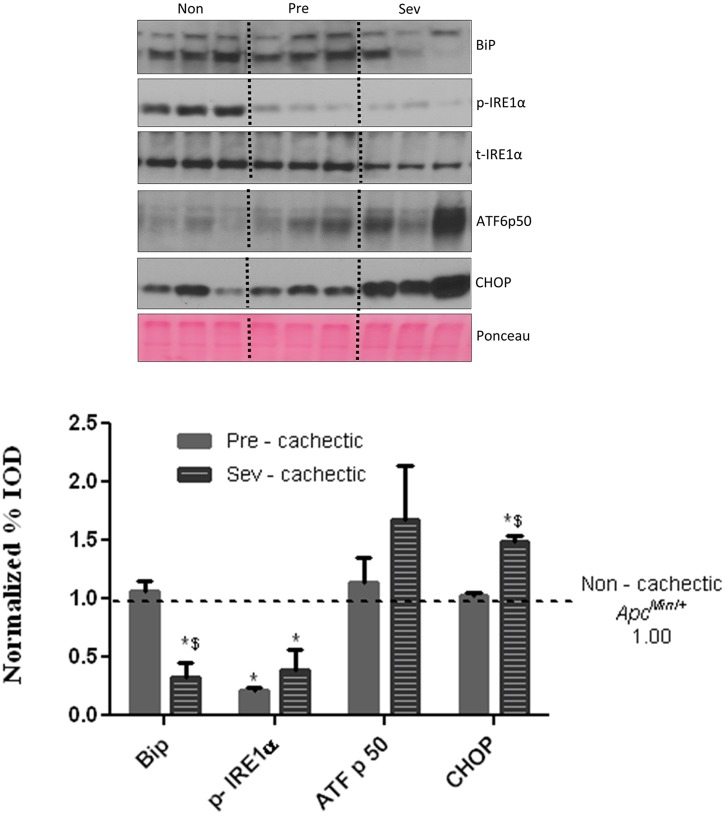
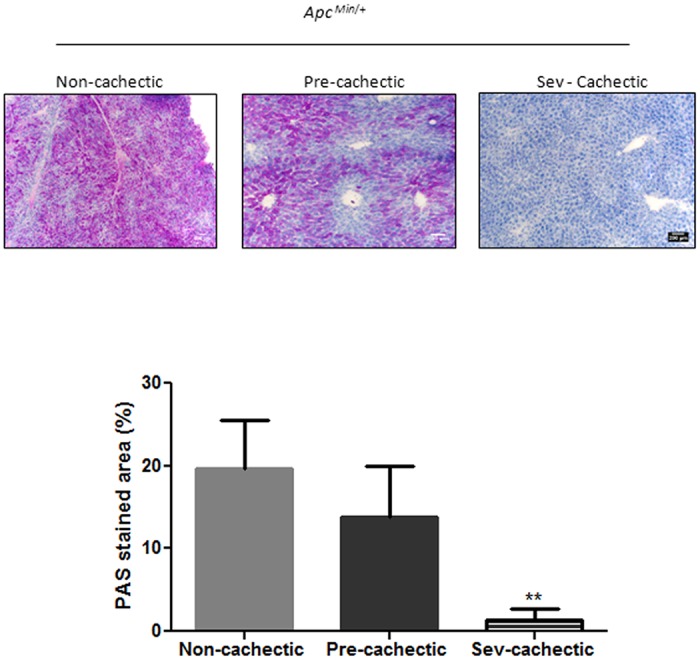
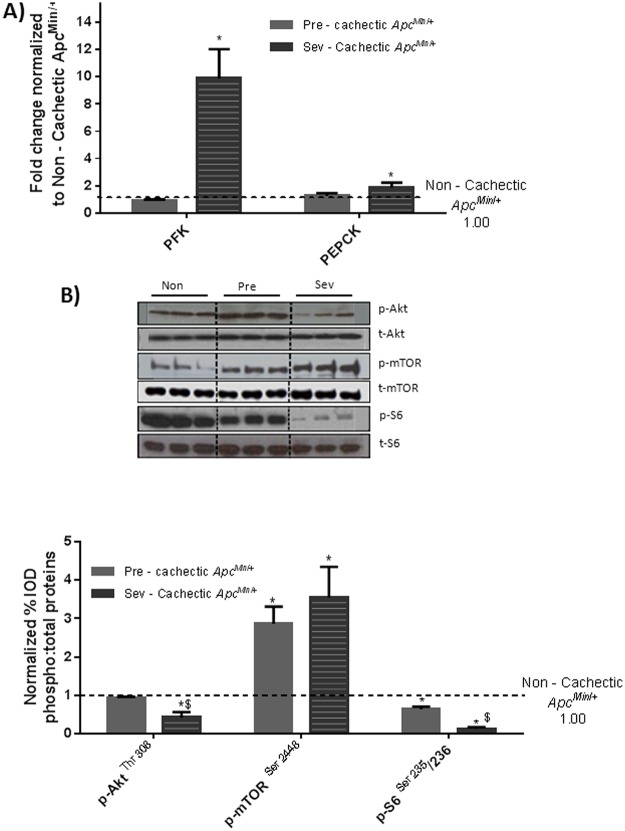
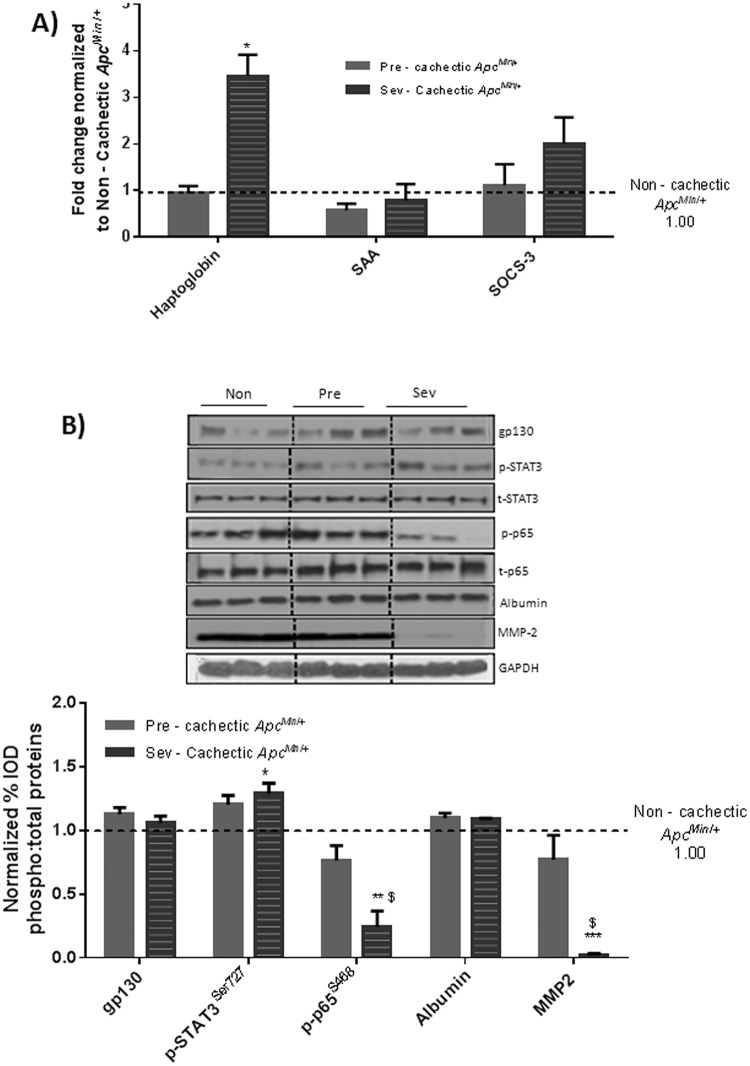
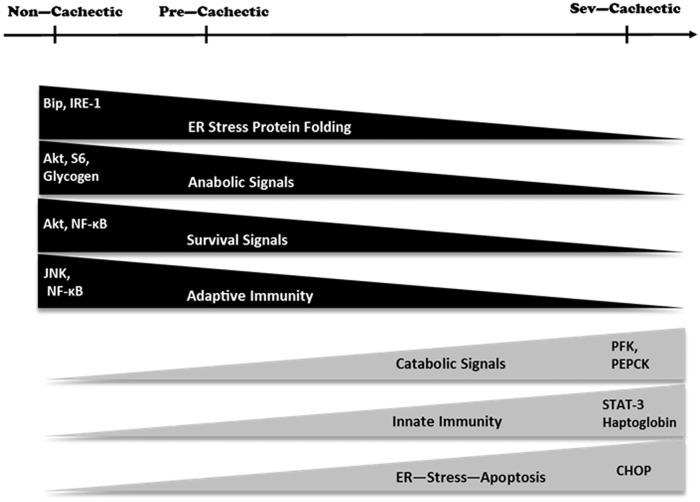
The ApcMin/+ mouse exhibits an intestinal tumor associated loss of muscle and fat that is accompanied by chronic inflammation, insulin resistance and hyperlipidemia. Since the liver governs systemic energy demands through regulation of glucose and lipid metabolism, it is likely that the liver is a pathological target of cachexia progression in the ApcMin/+ mouse. The purpose of this study was to determine if cancer and the progression of cachexia affected liver endoplasmic reticulum (ER)-stress, inflammation, metabolism, and protein synthesis signaling. The effect of cancer (without cachexia) was examined in wild-type and weight-stable ApcMin/+ mice. Cachexia progression was examined in weight-stable, pre-cachectic, and severely-cachectic ApcMin/+ mice. Livers were analyzed for morphology, glycogen content, ER-stress, inflammation, and metabolic changes. Cancer induced hepatic expression of ER-stress markers BiP (binding immunoglobulin protein), IRE-1α (endoplasmic reticulum to nucleus signaling 1), and inflammatory intermediate STAT-3 (signal transducer and activator of transcription 3). While gluconeogenic enzyme phosphoenolpyruvate carboxykinase (PEPCK) mRNA expression was suppressed by cancer, glycogen content or protein synthesis signaling remained unaffected. Cachexia progression depleted liver glycogen content and increased mRNA expression of glycolytic enzyme PFK (phosphofrucktokinase) and gluconeogenic enzyme PEPCK. Cachexia progression further increased pSTAT-3 but suppressed p-65 and JNK (c-Jun NH2-terminal kinase) activation. Interestingly, progression of cachexia suppressed upstream ER-stress markers BiP and IRE-1α, while inducing its downstream target CHOP (DNA-damage inducible transcript 3). Cachectic mice exhibited a dysregulation of protein synthesis signaling, with an induction of p-mTOR (mechanistic target of rapamycin), despite a suppression of Akt (thymoma viral proto-oncogene 1) and S6 (ribosomal protein S6) phosphorylation. Thus, cancer induced ER-stress markers in the liver, however cachexia progression further deteriorated liver ER-stress, disrupted protein synthesis regulation and caused a differential inflammatory response related to STAT-3 and NF-κB (Nuclear factor-κB) signaling.


Conflict of interest statement

Competing Interests: The authors have declared that no competing interests exist.

Figures

Fig 1
Fig 1. Effect of cachexia progression on liver morphology and MAPK signaling.
A) Hematoxlyin and Eosin Staining of liver section for C57BL/6 (N = 3), Non—cachectic (N = 4) and severely cachectic (N = 4) Apc Min/+ mice. Pathological scoring for the sections was done in accordance to the HAI scale B) Expression of levels of phosphorylated ERK and JNK in the liver (N = 6 per group). Values are expressed as Mean ± SE. * denotes significantly different from the non—cachectic Apc Min/+ mouse analyzed by One—Way ANOVA. p < 0.05.
Fig 2
Fig 2. Effect of cancer on ER stress markers.
Bip1, IRE-1, ATF-6 p50 and CHOP expression in the liver of non—cachectic Apc Min/+ mice (N = 6 per group), compared to healthy C57BL/6 mice. Dotted line on the western blot indicates two different sections of the same gel. Values are expressed as Mean ± SE. * denotes significantly different from the healthy C57BL/6 mice as analyzed by a pre—planned t—test. p < 0.05.
Fig 3
Fig 3. Effect of cancer liver glycogen stores.
A) Glycogen stores as determined by PAS staining. B) Morphometry for the PAS stain to estimate glycogen stores in the WT and non—cachectic liver. N = 8 for healthy C57BL/6 and 5—non—cachectic Apc Min/+ were used for the analysis. Values are expressed as Mean ± SE. p < 0.05.
Fig 4
Fig 4. Effect of cancer on liver metabolic and anabolic signaling in non—cachectic mice.
A) Liver mRNA expression of metabolic genes PFK and PEPCK B) Protein expression liver anabolic signaling in the non-cachectic mice. Values are expressed as Mean ± SE. * denotes significantly different from C57BL/6 as analyzed by a pre—planned t—test. Values are normalized either to the respective total protein for phosphoproteins and to GAPDH for non—phosphorylated proteins. (n = 5–6 per group, p < 0.05) Dotted line on the graph indicates levels of C57BL/6, while the dotted line on the western blots indicate two different parts of the same gel.
Fig 5
Fig 5. Effect of cancer on liver inflammatory signaling in non—cachectic mice.
A) Liver mRNA expression of inflammatory markers B) Protein expression liver inflammatory signaling in the non-cachectic mice. Values are expressed as Mean ± SE. * denotes significantly different from C57BL/6 as analyzed by a pre—planned t-test. Values are normalized either to the respective total protein for phosphoproteins and to GAPDH for non—phosphorylated proteins. (n = 5–6 per group, p < 0.05) Dotted line on the graph indicates levels of C57BL/6, while the dotted line on the western blot indicates two different parts of the same gel.
Fig 6
Fig 6. Hepatic ER stress markers with cachexia progression.
ER stress markers Bip, IRE1α, ATF6p50 and CHOP were examined in the liver of non, pre and severely cachectic mice. Values are expressed as Mean ± SE. (n = 6–8 per group, p < 0.05) Dotted line indicates levels of Non—cachectic mice. Non = Non—Cachectic Apc Min/+ Sev = severely cachectic Apc Min/+; * denotes significantly different from Non—cachectic Apc Min/+ $ denotes different from the pre—cachectic Apc Min/+ mice, as analyzed by a One—Way ANOVA, p < 0.05.
Fig 7
Fig 7. Changes in liver glycogen stores with cachexia progression.
Glycogen stores as determined by PAS staining and quantified using the ImageJ software in the non (N = 5), pre (N = 7) and severely (N = 7) cachectic Apc Min/+ mice. Values are expressed as Mean ± SE. * denotes significantly different from the Non—cachectic Apc Min/+ as determined by One—Way ANOVA, p< 0.05.
Fig 8
Fig 8. Changes in liver metabolic and anabolic markers with cachexia progression.
A) Liver mRNA expression of metabolic genes PFK and PEPCK B) Protein expression liver anabolic signaling with cachexia progression. Values are expressed as Mean ± SE. * denotes significantly different from Non—cachectic Apc Min/+ $ denotes significant difference from the pre—cachectic Apc Min/+ mice as analyzed by One—Way ANOVA. Values are normalized either to the respective total protein for phosphoproteins and to GAPDH for non—phosphorylated proteins. (n = 5–6 per group, p < 0.05) Dotted line on the graph indicates levels of Non—cachectic Apc Min/+, while a dotted line on the Western blot indicates different regions of the same gel. Non = Non—Cachectic Apc Min/+ Sev = severely cachectic Apc Min/+.
Fig 9
Fig 9. Liver inflammatory signaling with cachexia progression.
A) Liver mRNA expression inflammatory markers B) Protein expression liver inflammatory signaling with cachexia progression. Values are expressed as Mean ± SE. * denotes significantly different from Non—cachectic Apc Min/+ $ denotes different from the pre—cachectic Apc Min/+ mice, as analyzed by One—Way ANOVA. Values are normalized either to the respective total protein for phosphoproteins and to GAPDH for non—phosphorylated proteins. (n = 5–6 per group, p < 0.05) Dotted line indicates levels of Non—cachectic Apc Min/+. Abbreviations: Non = Non—Cachectic Apc Min/+ Pre = Pre-cachectic Apc Min/+ Sev = severely cachectic Apc Min/+.
Fig 10
Fig 10. Schematic diagram describing the molecular signaling associated with cachexia progression in the liver.

Similar articles

Cited by

References

    1. Tisdale MJ (2009) Mechanisms of cancer cachexia. Physiol Rev 89: 381–410. 10.1152/physrev.00016.2008 - DOI - PubMed
    1. Tazi E, Errihani H (2010) Treatment of cachexia in oncology. Indian J Palliat Care 16: 129–137. 10.4103/0973-1075.73644 - DOI - PMC - PubMed
    1. Lieffers JR, Mourtzakis M, Hall KD, McCargar LJ, Prado CM, Baracos VE (2009) A viscerally driven cachexia syndrome in patients with advanced colorectal cancer: contributions of organ and tumor mass to whole-body energy demands. Am J Clin Nutr 89: 1173–1179. 10.3945/ajcn.2008.27273 - DOI - PMC - PubMed
    1. Holroyde CP, Skutches CL, Boden G, Reichard GA (1984) Glucose metabolism in cachectic patients with colorectal cancer. Cancer Res 44: 5910–5913. - PubMed
    1. Tisdale MJ (2002) Cachexia in cancer patients. Nat Rev Cancer 2: 862–871. - PubMed

Publication types

MeSH terms