. 2015 Mar 19:6:6604.
doi: 10.1038/ncomms7604.

Rise and fall of subclones from diagnosis to relapse in pediatric B-acute lymphoblastic leukaemia

Affiliations

Rise and fall of subclones from diagnosis to relapse in pediatric B-acute lymphoblastic leukaemia

Xiaotu Ma et al. Nat Commun. .

Abstract

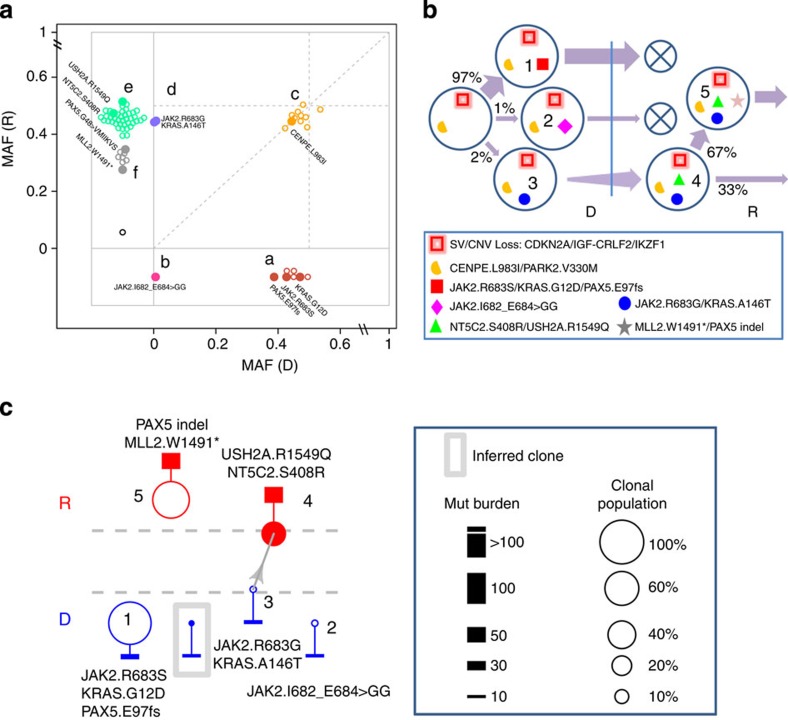
There is incomplete understanding of genetic heterogeneity and clonal evolution during cancer progression. Here we use deep whole-exome sequencing to describe the clonal architecture and evolution of 20 pediatric B-acute lymphoblastic leukaemias from diagnosis to relapse. We show that clonal diversity is comparable at diagnosis and relapse and clonal survival from diagnosis to relapse is not associated with mutation burden. Six pathways were frequently mutated, with NT5C2, CREBBP, WHSC1, TP53, USH2A, NRAS and IKZF1 mutations enriched at relapse. Half of the leukaemias had multiple subclonal mutations in a pathway or gene at diagnosis, but mostly with only one, usually minor clone, surviving therapy to acquire additional mutations and become the relapse founder clone. Relapse-specific mutations in NT5C2 were found in nine cases, with mutations in four cases being in descendants of the relapse founder clone. These results provide important insights into the genetic basis of treatment failure in ALL and have implications for the early detection of mutations driving relapse.


Figures

Figure 1
Figure 1. Recurrently mutated pathways and genes in 20 ALL trios.
Mutations present in diagnosis (D) and relapse (R) tumour of each case are shown in two rows. SNVs and indels are shown in red or magenta in shades that match their MAF indicated by the colour scale. Copy-number alterations (including deletion and amplification) are shown in cyan, while SVs are represented by black open boxes. Presence of both SVs and CNVs in the same gene depicts a single lesion in which SV breakpoints determined by sequencing data corroborates CNV segment boundary. Cases with oncogenic fusions involving TCF3, ETV6, RUNX1 and CRLF2 are marked at the top along with hypermutators having over 100 SNVs/indels at relapase. SV data for PANTSM, PAPNNX, PASKAY and PAPEFH are not available as they were not analysed by WGS.
Figure 2
Figure 2. Three subclonal JAK2 mutations in patient PAPSPN.
(a) Alignment of sequencing reads that harbour the three mutations present at diagnosis. (b) Sequencing read count of mutant (to the right of y axis) and wild-type (to the left of y axis) alleles of the three mutations categorized into diagnosis (black), remission (blue) and relapse (red) classes in the discovery sequencing (WXS, left) and verification sequencing (right). Colour code of mutations matches that of a.
Figure 3
Figure 3. Clonal architecture of diagnosis and relapse samples for PAPSPN.
(a) Six mutation clusters (marked af) constructed from MAF at diagnosis (D; x axis value) and relapse (R; y axis value). Shared mutations are shown in the large square in the centre, while the rectangular areas at the bottom and the left display D- and R-specific mutation clusters, respectively. Each mutation cluster is highlighted in colour with individual mutation marked by an open dot. A mutation in a key pathway is labelled and marked by a solid dot. The MAFs are not normalized by tumour purity. (b) Clonal lineages at diagnosis and relapse. Each clone is identified with a number. Mutation clusters present in each clone are marked by distinct shapes in colours that match those in a. Key mutations as well as CNVs and SVs in each cluster are labelled in the legend. D and R are demarcated by a vertical blue bar. Clonal population size is labelled as percentage of tumour content. The thickness of an arrow from a progenitor clone to its descendant is proportional to population change. ‘Falling’ clones that did not survive therapy are marked by an X. (c) Pattern of rise and fall of subclones from diagnosis to relapse. The legend for the symbols is shown at the right. Remission was marked by dashed lines that separate diagnosis and relapse. Each clone is shown by a circle drawn in proportion to its population size and attached with a bar whose thickness is proportional to mutation burden. A founder clone at D or R is indicated by a solid circle. An inferred founder with population frequency below the detection level (<1%) is marked by a grey box. The clones at D and R are shown in blue and red, respectively. Representive mutations specific to each clonal lineage are marked. A rising clone in relapse that survived therapy is connected to its progenitor at diagnosis by a line.
Figure 4
Figure 4. Clonal architecture of diagnosis and relapse samples for PARJZZ.
(a) Five mutation clusters (marked ae) constructed from MAF at diagnosis (D) and relapse (R). (b) Clonal lineages from diagnosis to relapse. Clone 2 harbours cluster b mutation labelled as KRAS p.Gly12Asp (green solid box) and CDKN2A focal deletion (black open box). Clone 3 harbours cluster c mutations labelled as KRAS p.Lys23Arg (blue solid box) and a different CDKN2A focal deletion (red open box). (c) Probe intensity of SNP array in germline (G), diagnosis (D) and relapse (R) for the genomic locus (chr9:19.3Mb-22.95Mb) of CDKN2A. Intensity of red and blue colour corresponds to the log2 ratio shown in the legend. The predominant CDKN2A lesions at diagnosis were two deletions marked by a black rectangle, while the predominant deletion at relapse is marked by a red rectangle and detectable at diagnosis in a subclone as indicated by the light-blue shaded regions in the diagnostic tumour. The genomic locations of the SVs encompassing the three deletions are shown below. (d) Dual lineage of the relapsed tumour with both clone 2 and clone 3 from diagnosis persisted to relapse but switched their clonal dominance.
Figure 5
Figure 5. Clonal architecture of diagnosis and relapse samples for case PASLZM.
(a) Six mutation clusters (marked af) constructed from MAF at diagnosis (D) and relapse (R). The splice mutation in PMS2 (A725_E12splice) is placed to cluster d because it is located on a haploid region due to loss of chromosome 7p at relapse. (b) Comparison of mutation spectra of relapse-specific clusters (cf) and all diagnosis (a+b) mutations. Relapse-specific clusters (d,e) show significantly higher (P<0.05, Fisher’s exact test; indicated by an asterisk) transition mutation rates (and mutation counts) than clusters c and a+b. (c) Clonal lineages from diagnosis to relapse and the ambiguous lineage of cluster e,f are resolved with the input from mutation spectrum analysis. Specifically, clone 5, which contains mutation cluster e with a total of 98 SNVs at a MAF of 0.15, can be considered as a descendant of either clone 4 or clone 3. As the mutation spectrum for cluster e is highly enriched for transition changes, consistent with cluster d mutations in clone 4 but significantly different (P=0.01, Fisher’s exact test) from that of cluster c mutations in clone 3, it is placed as a descendant of clone 4 instead of clone 3. Clone 6 contains 21 lineage-specific mutations of cluster f with a MAF of ~0.05. It would have an ambiguous clonal linage that could have descended from clone 3, or clone 4 or clone 5 if compatibility of population frequency is the only criteria for determining lineage. It was placed under clone 3 as its mutation spectrum is significantly different from that of clones 4 and 5 but not from that of clone 3. (d) Probe intensity of SNP array in germline (G), diagnosis (D) and relapse (R) on chromosome 7. Isochromosome 7q (that is, loss of 7p and gain of 7q) demonstrated a low signal intensity due to low tumour purity at diagnosis and is present in all tumour cells at relapse.
Figure 6
Figure 6. The pattern of rise and fall of subclones from diagnosis to relapse of the 20 cases analysed in this study.
PARPNM is marked by an asterisk (*) due to potential underestimation of clonal diversity at relapse due to low tumour purity (<20%). The graphic representation is the same as Fig. 3c. The four relapse subclones in PARFTR harbour distinct NT5C2 mutations and are marked with a #. Subclones which acquired (but not inherited) mutations in the seven relapse-enriched genes and DNA mismatch repair genes are labelled with the corresponding gene symbols. PAPEFH, PAPNNX, PAPZNK, PARPNM and PASFXA are the five cases in which the rising clone originated from a predominant clone at diagnosis.

References

    1. Pui C. H., Mullighan C. G., Evans W. E. & Relling M. V. Pediatric acute lymphoblastic leukemia: where are we going and how do we get there? Blood 120, 1165–1174 (2012) . - PMC - PubMed
    1. Place A. E., Frederick N. N. & Sallan S. E. Therapeutic approaches to haematological malignancies in adolescents and young adults. Br. J. Haematol. 164, 3–14 (2014) . - PubMed
    1. Schrappe M. et al. Key treatment questions in childhood acute lymphoblastic leukemia: results in 5 consecutive trials performed by the ALL-BFM study group from 1981 to 2000. Klin. Padiatr. 225, (Suppl 1): S62–S72 (2013) . - PubMed
    1. Vora A. et al. Treatment reduction for children and young adults with low-risk acute lymphoblastic leukaemia defined by minimal residual disease (UKALL 2003): a randomised controlled trial. Lancet Oncol. 14, 199–209 (2013) . - PubMed
    1. Mullighan C. G. et al. CREBBP mutations in relapsed acute lymphoblastic leukaemia. Nature 471, 235–239 (2011) . - PMC - PubMed

Publication types

MeSH terms

Associated data