. 2015 Mar 19;10(3):e0120279.
doi: 10.1371/journal.pone.0120279. eCollection 2015.

Contributions of electric and acoustic hearing to bimodal speech and music perception

Affiliations

Contributions of electric and acoustic hearing to bimodal speech and music perception

Joseph D Crew et al. PLoS One. .

Abstract

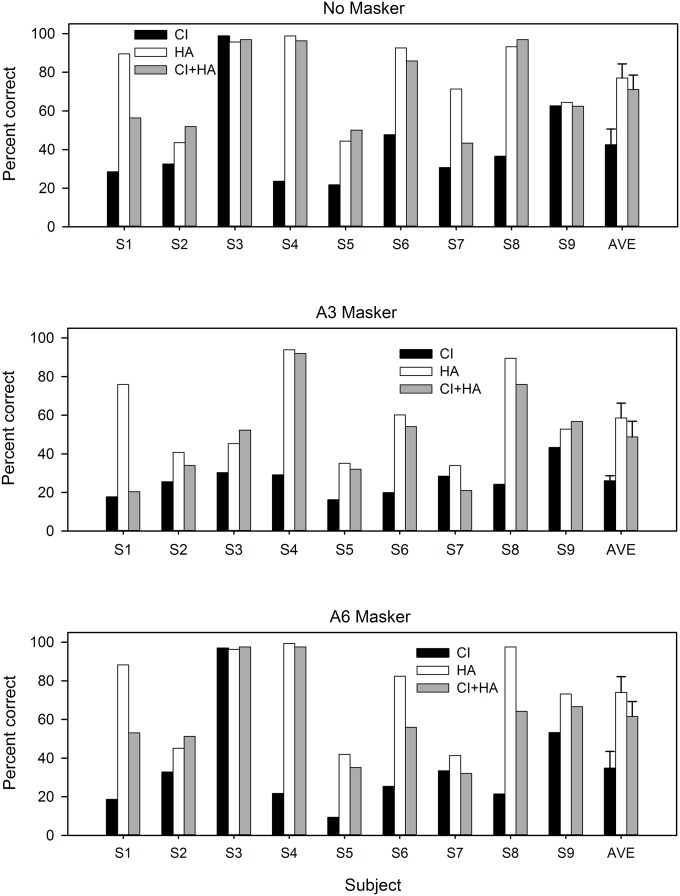
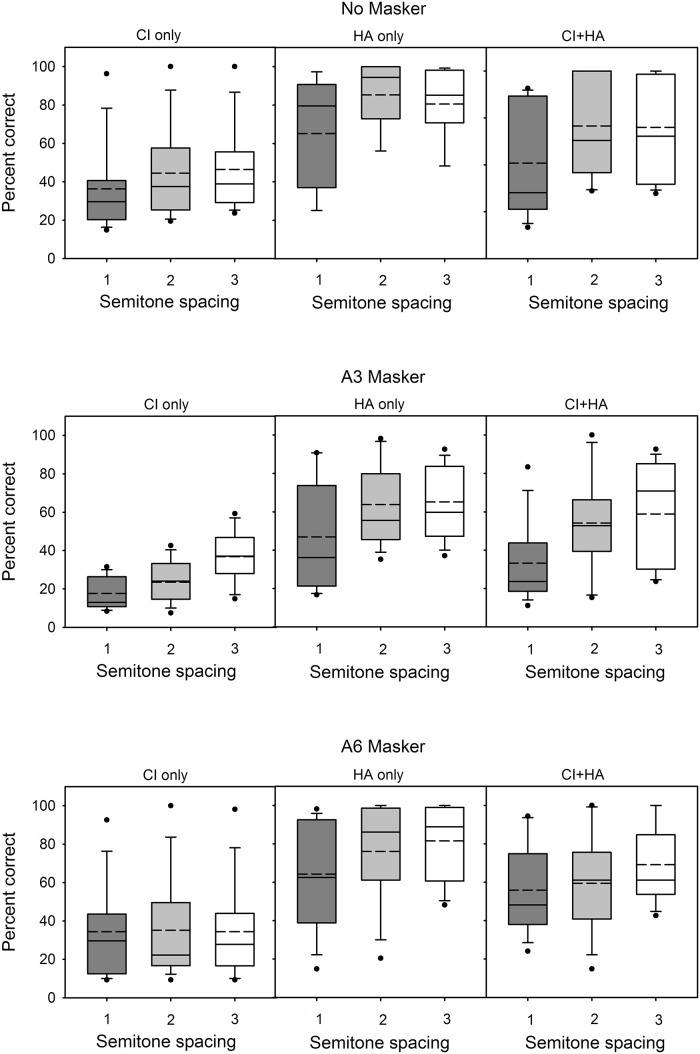
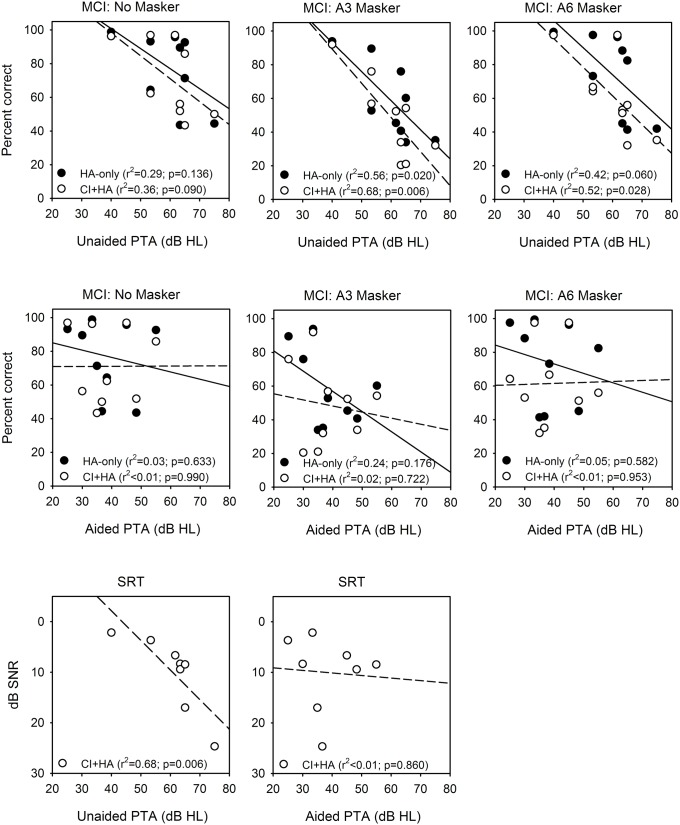
Cochlear implant (CI) users have difficulty understanding speech in noisy listening conditions and perceiving music. Aided residual acoustic hearing in the contralateral ear can mitigate these limitations. The present study examined contributions of electric and acoustic hearing to speech understanding in noise and melodic pitch perception. Data was collected with the CI only, the hearing aid (HA) only, and both devices together (CI+HA). Speech reception thresholds (SRTs) were adaptively measured for simple sentences in speech babble. Melodic contour identification (MCI) was measured with and without a masker instrument; the fundamental frequency of the masker was varied to be overlapping or non-overlapping with the target contour. Results showed that the CI contributes primarily to bimodal speech perception and that the HA contributes primarily to bimodal melodic pitch perception. In general, CI+HA performance was slightly improved relative to the better ear alone (CI-only) for SRTs but not for MCI, with some subjects experiencing a decrease in bimodal MCI performance relative to the better ear alone (HA-only). Individual performance was highly variable, and the contribution of either device to bimodal perception was both subject- and task-dependent. The results suggest that individualized mapping of CIs and HAs may further improve bimodal speech and music perception.


Conflict of interest statement

Competing Interests: The authors have declared that no competing interests exist.

Figures

Fig 1
Fig 1. Audiometric thresholds for each subject for different hearing devices.
CI+HA (black circles), CI (red boxes), HA (green triangles), and unaided (white triangles) thresholds are shown for each subject. Thresholds greater than 80 dB HL are not shown.
Fig 2
Fig 2. Spectrograms and electrodograms for the No Masker condition for 1- and 3-semitone spacings.
The far left panel shows a schematic representation of HA and CI frequency ranges. The target contour is shown in black. The middle two panels show a spectral representation of the original stimuli (left) and simulated HA output (right). A steeply sloping hearing loss was simulated using AngelSim and is intended for illustrative purposes only. The far right panel shows an idealized electrodogram representing the electrical stimulation patterns for a CI. Electrodograms were simulated using default stimulation parameters for the Cochlear Freedom and Nucleus-24 devices: 900 Hz/channel stimulation rate, 8 maxima, frequency allocation Table 6, etc.
Fig 3
Fig 3. Spectrograms and electrodograms for the A3 and A6 Masker conditions.
The top half of the figure shows (from left to right) a schematic representation of the test condition in relation to the frequency ranges of the HA and the CI, a spectrogram of the original stimuli, a spectrogram of the simulated HA output, and an idealized electrodogram for the A3 Masker condition; the bottom half shows the same information for the A6 Masker condition. Figure details are similar to the details of Fig. 2. The target instrument notes are shown in black and the masking instrument notes are shown in gray.
Fig 4
Fig 4. Speech-in-noise results for individual subjects across hearing devices.
CI-only SRTs are shown by the black bars, HA-only SRTs are shown by the white bars, and CI+HA SRTs are shown by the gray bars. Mean performance is shown at the far right; error bars indicate standard error. Asterisks indicate that SRTs could not be measured for that condition. Bars closer to the top of the graph indicate better performance.
Fig 5
Fig 5. MCI performance for individual subjects across hearing devices and masker condition.
CI-only performance is shown by the black bars, HA-only performance is shown by the white bars, and CI+HA performance is shown by the gray bars. Mean performance is shown at the far right within each masker condition; error bars indicate standard error. MCI with No Masker is shown in the top panel, MCI with the overlapping, A3 Masker is shown in the middle panel, and MCI with the non-overlapping, A6 Masker is shown in the bottom panel.
Fig 6
Fig 6. Boxplots of MCI performance as a function of semitone spacing, for the different listening and masker conditions.
The columns indicate hearing device (CI, HA, and CI+HA) and the rows indicate masker condition (No Masker, A3 Masker, A6 Masker). The edges of the boxes represent the 25th and 75th percentiles, the solid line represents the median, the dashed line represents the mean, the error bars indicate the 10th and 90th percentiles, and the points outside of the error bars indicate outliers.
Fig 7
Fig 7. Scatter plots of music and speech performance versus unaided and aided thresholds in the non-implanted ear.
The top row shows MCI performance for the No Masker (left), A3 Masker (middle), and A6 Masker conditions (right), as a function of unaided PTAs at 125 Hz, 250 Hz, and 500 Hz. The solid circles show data for the HA-only condition; the solid line shows the linear regression (r2 and p-values are shown in the legend in each panel). The open circles show data for the CI+HA condition; the dashed line shows the linear regression. The middle row shows similar plots, but as a function of aided PTAs at 125 Hz, 250 Hz, and 500 Hz. The bottom row shows SRTs as a function of unaided PTAs (left) or aided PTAs (middle). Only CI+HA SRT data is shown.

References

    1. Dorman MF, Gifford RH. Combining acoustic and electric stimulation in the service of speech recognition. Int. J. Audiol. 2010; 49: 912–919. 10.3109/14992027.2010.509113 - DOI - PMC - PubMed
    1. Gfeller K, Christ A, Knutson JF, Witt S, Murray KT, Tyler RS. Musical backgrounds, listening habits, and aesthetic enjoyment of adult cochlear implant recipients. J. Am. Acad. Audiol. 2000; 7: 390–406. - PubMed
    1. McDermott HJ. Music perception with cochlear implants: a review. Trends Amplif. 2004; 8: 49–82. - PMC - PubMed
    1. Limb CJ, Rubinstein JT. Current research on music perception in cochlear implant users. Otolaryngol. Clin. N. Am. 2012; 45: 129–140. - PubMed
    1. Armstrong M, Pegg P, James C, Blamey P. Speech perception in noise with implant and hearing aid. Am. J. Otol. 1997; 18: S140–S141. - PubMed

Publication types