. 2015;9(4):4173-81.
doi: 10.1021/acsnano.5b00396. Epub 2015 Mar 23.

Multiplex serum cytokine immunoassay using nanoplasmonic biosensor microarrays

Affiliations

Multiplex serum cytokine immunoassay using nanoplasmonic biosensor microarrays

Pengyu Chen et al. ACS Nano. 2015.

Abstract

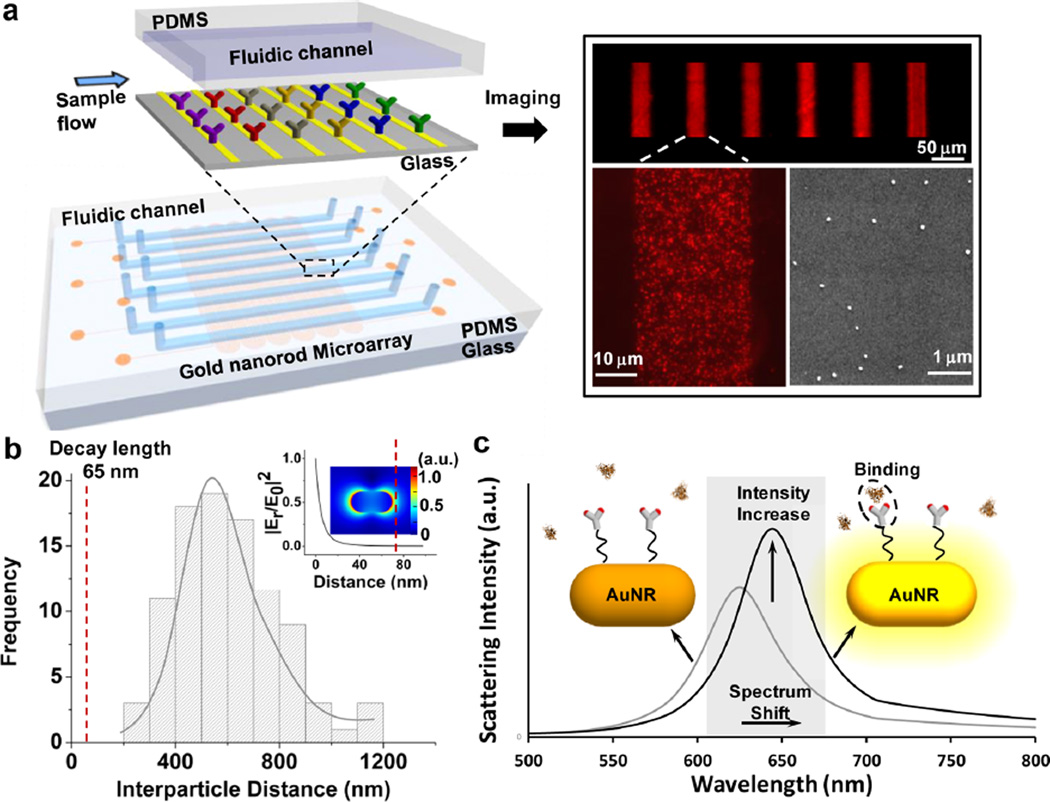
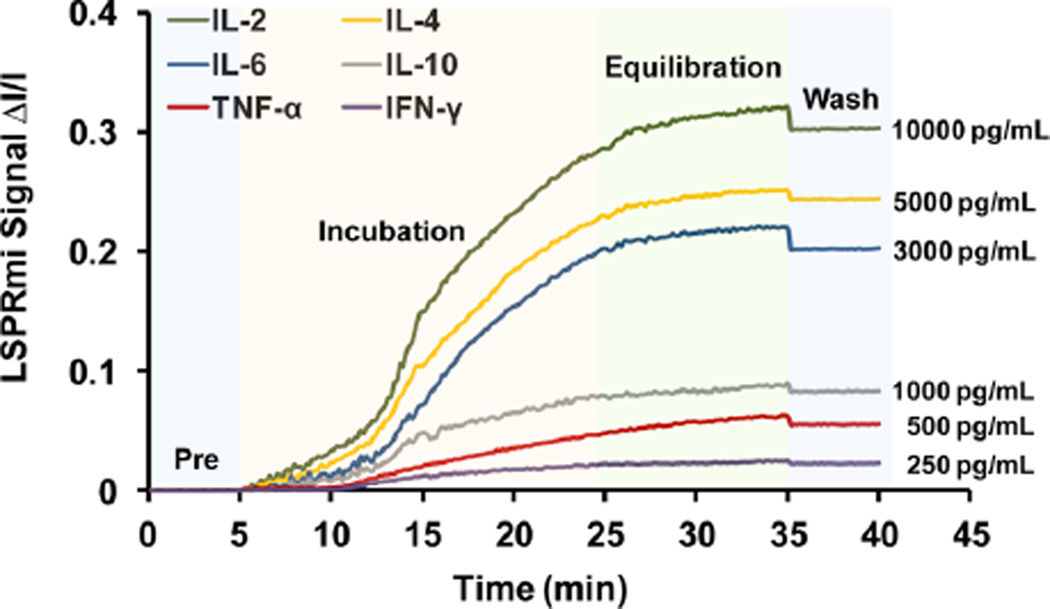
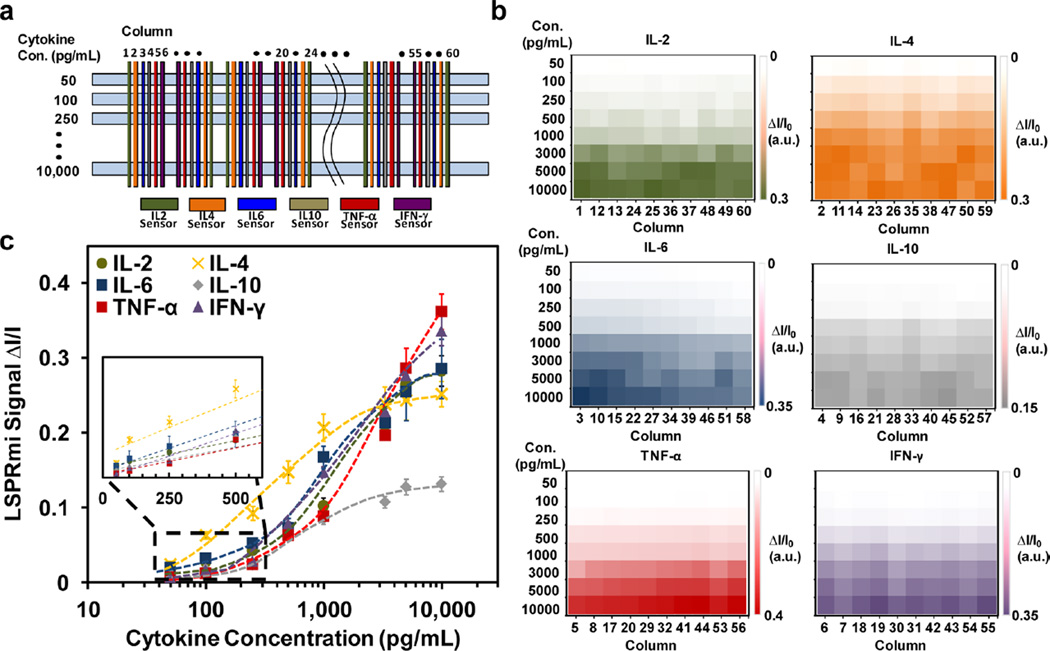
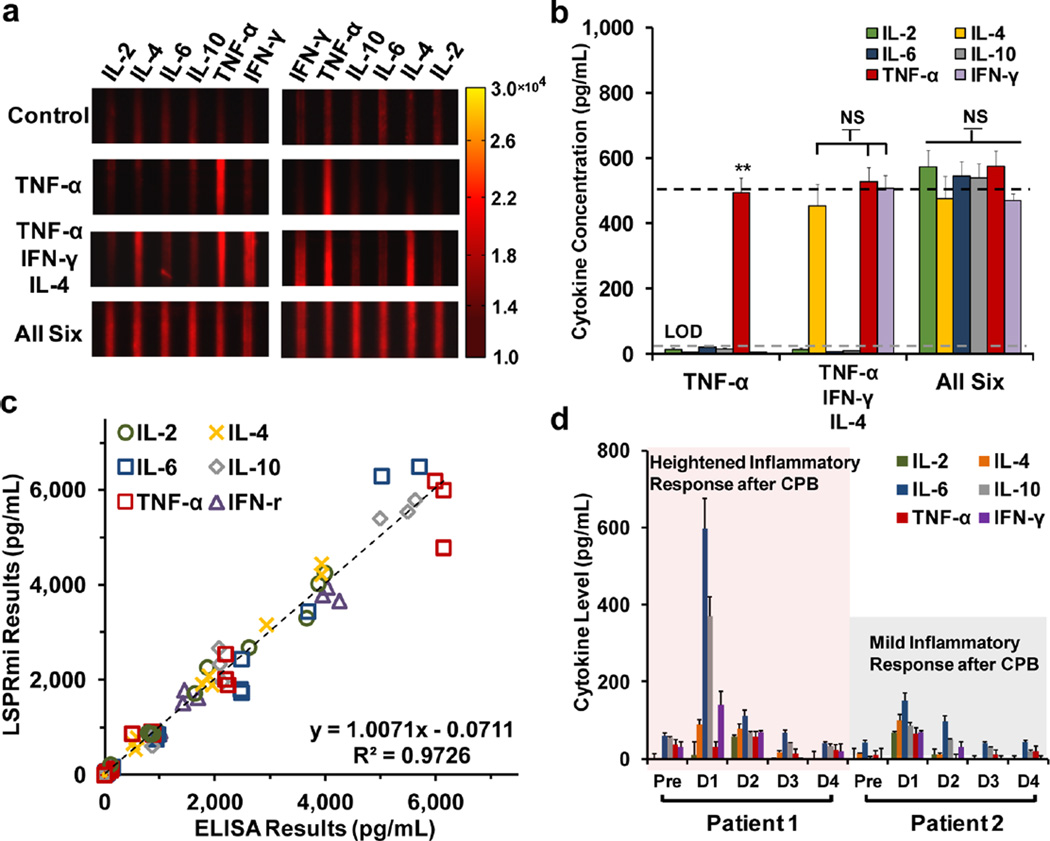
Precise monitoring of the rapidly changing immune status during the course of a disease requires multiplex analysis of cytokines from frequently sampled human blood. However, the current lack of rapid, multiplex, and low volume assays makes immune monitoring for clinical decision-making (e.g., critically ill patients) impractical. Without such assays, immune monitoring is even virtually impossible for infants and neonates with infectious diseases and/or immune mediated disorders as access to their blood in large quantities is prohibited. Localized surface plasmon resonance (LSPR)-based microfluidic optical biosensing is a promising approach to fill this technical gap as it could potentially permit real-time refractometric detection of biomolecular binding on a metallic nanoparticle surface and sensor miniaturization, both leading to rapid and sample-sparing analyte analysis. Despite this promise, practical implementation of such a microfluidic assay for cytokine biomarker detection in serum samples has not been established primarily due to the limited sensitivity of LSPR biosensing. Here, we developed a high-throughput, label-free, multiarrayed LSPR optical biosensor device with 480 nanoplasmonic sensing spots in microfluidic channel arrays and demonstrated parallel multiplex immunoassays of six cytokines in a complex serum matrix on a single device chip while overcoming technical limitations. The device was fabricated using easy-to-implement, one-step microfluidic patterning and antibody conjugation of gold nanorods (AuNRs). When scanning the scattering light intensity across the microarrays of AuNR ensembles with dark-field imaging optics, our LSPR biosensing technique allowed for high-sensitivity quantitative cytokine measurements at concentrations down to 5-20 pg/mL from a 1 μL serum sample. Using the nanoplasmonic biosensor microarray device, we demonstrated the ability to monitor the inflammatory responses of infants following cardiopulmonary bypass (CPB) surgery through tracking the time-course variations of their serum cytokines. The whole parallel on-chip assays, which involved the loading, incubation, and washing of samples and reagents, and 10-fold replicated multianalyte detection for each sample using the entire biosensor arrays, were completed within 40 min.

Keywords: localized surface plasmon resonance (LSPR); multiplexed immunoassay; nanoplasmonic sensing; optofluidics; serum cytokines.


Figures

Figure 1
Figure 1
Schematic and principle of the method. (a) Schematic of the LSPR microarray chip. The nanorod microarray fabrication was performed using a one-step microfluidic patterning technique assisted by electrostatic attractive interactions between the nanorods and the substrate surface within microfluidic channels (Materials and Methods and Supporting Information Section 2). Subsequently, these nanorode microarrays were integrated in a microfluidic chip with eight parallel microfluidic detection channels consisting of inlet and outlet ports for reagent loading and washing. Specific antibodies were conjugated to the patterned AuNR microarrays using thiolated cross-linker and EDC/NHC chemistry. The current chip design integrates 480 AuNR microarray sensor spots. The prepared LSPR microarray chip was then imaged under dark-field microscopy and scanning electron microscopy (SEM). (b) Histograms of the particle-to-particle distance of the AuNRs on the LSPR microarray chip characterized using SEM images. The resulted interparticle distance was measured to be >200 nm, much larger than the decay length of the localized electric field on the AuNR surface as shown in the inserted EM simulation. (c) The principle of the LSPR microarray method. Analyte molecules are introduced to an antibody-functionalized AuNR LSPR biosensor. Binding of the analyte molecules to the receptors induces a redshift and scattering intensity change of the longitudinal SPR (exaggerated in the illustration). This intensity change is imaged via the characteristic frequency (gray area) using EMCCD coupled dark-field microscopy.
Figure 2
Figure 2
Real-time AuNR microarray signals during the multiplex cytokine detection. The blue region shows the LSPR microarray signal during the preloading. The orange and green regions show the transient increase and final equilibration of LSPR microarray signals, respectively, during incubation following the sample loading. The gray region shows the LSPR microarray signal after washing.
Figure 3
Figure 3
LSPR microarray intensity mapping and calibration curves obtained by a massively parallel on-chip assay. (a) LSPR microarray chip layout consisting of 60 antibody-functionalized AuNR stripes segmented by 8 microfluidic detection channels. This layout results in 480 total sensor spots on a single chip. The target cytokine at each AuNR stripe is color-coded. The sensor calibration was performed for the 480 sensor spots in a massively parallel manner by sequentially loading purified solutions of IL-2, IL-4, IL-6, IL-10, TNF-α, and IFN-γ into each detection channel and detecting the LSPR signals of the multiple sensor spots. The cytokine concentrations introduced to the detection channels are 50 pg/mL in Channel 1; 100 pg/mL in Channel 2; 250 pg/mL in Channel 3; 500 pg/mL in Channel 4; 1000 pg/mL in Channel 5; 3000 pg/mL in Channel 6; 5000 pg/mL in Channel 7; and 10 000 pg/mL in Channel 8. These concentration values are set to be the same for all the six cytokines in each channel. (b) Mapping of LSPR signal intensity shifts over the 480 AuNR barcode sensor spots on the LSPR microarray chip obtained by the multianalyte calibration process for the six cytokines in (a). The process enables the 480-spot signal reading within 5 min after loading, incubating, and washing these cytokines. The intensity unit is arbitrary unit obtained from the EMCCD. (c) Calibration curves of TNF-α, IFN-γ, IL-2, IL-4, IL-6, IL-10 obtained from the LSPR barcode intensity mapping in (b). The dashed lines represent the sigmoidal curves fitted to data points. The inserted figure shows the linear region of the calibrations curves at low concentrations.
Figure 4
Figure 4
Multiplex cytokine detection in healthy donor serum matrix and patient serum samples. (a) Dark-field images of AuNR microarrays within a single microfluidic detection channel loaded with different sample mixtures of recombinant cytokines spiked in serum matrix. The concentration of every cytokine in the mixtures is 500 pg/mL. (b) Cytokine concentrations quantified for the samples in (a). Measuring the scattering light intensities of the barcodes and converting them to concentration values using calibration curves allowed for the quantification of the cytokine concentrations. The dashed line in black represents the predetermined value (500 pg/mL) of the analyte concentration. The dashed line in gray represents the limit of detection (LOD) of the LSPR microarray mesurement. (c) Correlation between data obtained from the LSPR microarray assay and gold standard ELISA for the spiked-in serum samples with cytokine concentrations ranging from 32 to 5000 pg/mL. (d) Five-day cytokine concentration variations measured by the LSPR microarray assay for serum samples extracted from two post-CPB-surgery pediatric patients. The patients were discharged from the pediatric intensive care unit (PICU) after the five-day blood sampling since clinicians determined that their health conditions returned to normal then. Statistical analysis of experimental data with respect to both the recombinant protein and stimulated PBMCs controls: *, p-value < 0.05; **, p-value < 0.01; NS, no significant difference (Student t test).

References

    1. Opal SM, DePalo VA. Anti-Inflammatory Cytokines. Chest. 2000;117:1162–1172. - PubMed
    1. Rothenberg EV. Cell Lineage Regulators in B and T Cell Development. Nat. Immunol. 2007;8:441–444. - PubMed
    1. Damas P, Canivet JL, de Groote D, Vrindts Y, Albert A, Franchimont P, Lamy M. Sepsis and Serum Cytokine Concentrations. Crit. Care Med. 1997;25:405–412. - PubMed
    1. Lippitz BE. Cytokine Patterns in Patients with Cancer: A Systematic Review. Lancet Oncol. 2013;14:E218–E228. - PubMed
    1. Maczynska I, Millo B, Ratajczak-Stefanska V, Maleszka R, Szych Z, Kurpisz M, Giedrys-Kalemba S. Proinflammatory Cytokine (IL-1 beta, IL-6, IL-12, IL-18 and TNF-alpha) Levels in Sera of Patients with Subacute Cutaneous Lupus Erythematosus (SCLE) Immunol. Lett. 2006;102:79–82. - PubMed

Publication types