

Abnormal myofiber morphology and limb dysfunction in claudication
- PMID: 25791828
- PMCID: PMC4512658
- DOI: 10.1016/j.jss.2015.02.011
Abnormal myofiber morphology and limb dysfunction in claudication
Abstract
Background: Peripheral artery disease (PAD), which affects an estimated 27 million people in Europe and North America, is caused by atherosclerotic plaques that limit blood flow to the legs. Chronic, repeated ischemia in the lower leg muscles of PAD patients is associated with loss of normal myofiber morphology and myofiber degradation. In this study, we tested the hypothesis that myofiber morphometrics of PAD calf muscle are significantly different from normal calf muscle and correlate with reduced calf muscle strength and walking performance.
Methods: Gastrocnemius biopsies were collected from 154 PAD patients (Fontaine stage II) and 85 control subjects. Morphometric parameters of gastrocnemius fibers were determined and evaluated for associations with walking distances and calf muscle strength.
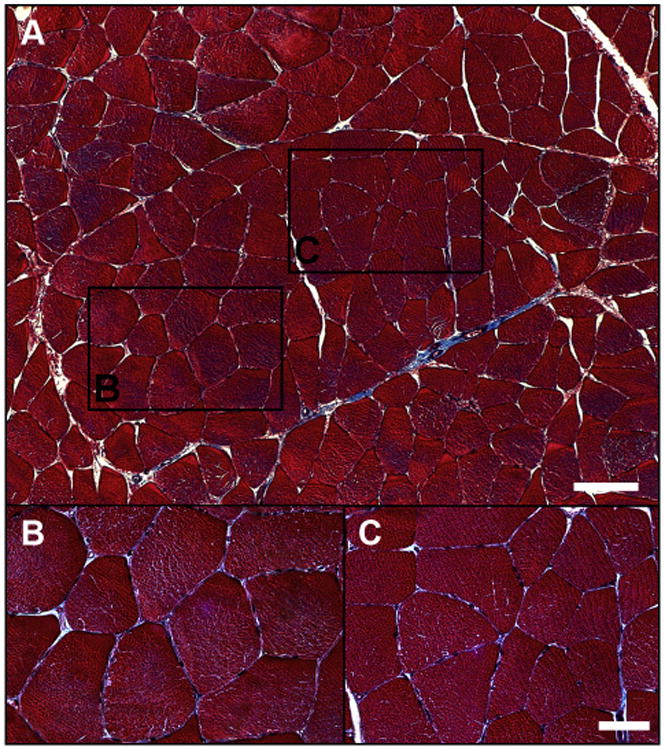
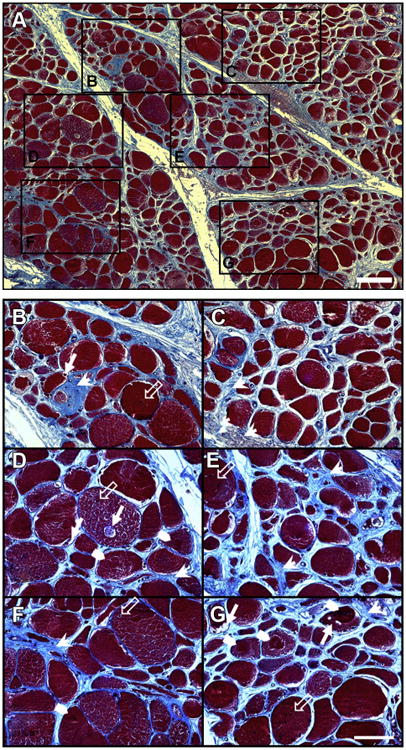
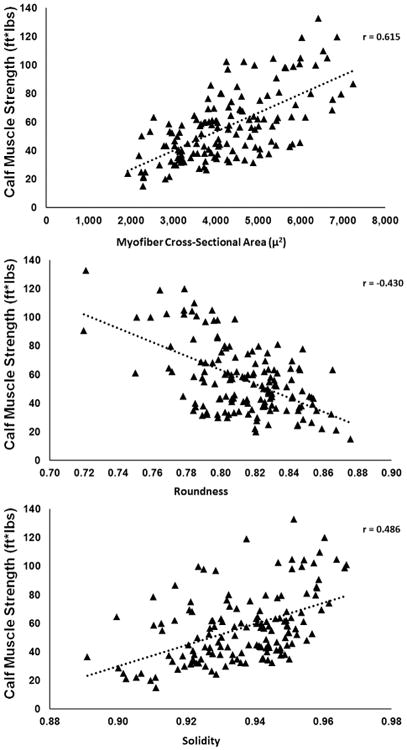
Results: Compared with control myofibers, PAD myofiber cross-sectional area, major and minor axes, equivalent diameter, perimeter, solidity, and density were significantly decreased (P < 0.005), whereas roundness was significantly increased (P < 0.005). Myofiber morphometric parameters correlated with walking distances and calf muscle strength. Multiple regression analyses demonstrated myofiber cross-sectional area, roundness, and solidity as the best predictors of calf muscle strength and 6-min walking distance, whereas cross-sectional area was the main predictor of maximum walking distance.
Conclusions: Myofiber morphometrics of PAD gastrocnemius differ significantly from those of control muscle and predict calf muscle strength and walking distances of the PAD patients. Morphometric parameters of gastrocnemius myofibers may serve as objective criteria for diagnosis, staging, and treatment of PAD.
Keywords: Claudication; Myofiber morphology; Walking distance.
Copyright © 2015 Elsevier Inc. All rights reserved.
Figures
References
-
- Roger VL, Go AS, Lloyd-Jones DM, et al. American Heart Association Statistics C. Stroke Statistics Subcommittee. Executive summary: heart disease and stroke statistics—2012 update: a report from the American Heart Association. Circulation. 2012;125:188. - PubMed
-
- Norgren L, Hiatt WR, Dormandy JA, et al. Inter-society consensus for the management of peripheral arterial disease (TASC II) J Vasc Surg. 2007;45(Suppl S):S5. - PubMed
-
- Brass EP, Hiatt WR. Acquired skeletal muscle metabolic myopathy in atherosclerotic peripheral arterial disease. Vasc Med. 2000;5:55. - PubMed
-
- Pipinos II, Judge AR, Selsby JT, et al. The myopathy of peripheral arterial occlusive disease: part 1. Functional and histomorphological changes and evidence for mitochondrial dysfunction. Vasc Endovascular Surg. 2007;41:481. - PubMed
Publication types
MeSH terms
Grants and funding
LinkOut - more resources
Full Text Sources
Other Literature Sources
