

B-cell reconstitution after lentiviral vector-mediated gene therapy in patients with Wiskott-Aldrich syndrome
- PMID: 25792466
- PMCID: PMC4559137
- DOI: 10.1016/j.jaci.2015.01.035
B-cell reconstitution after lentiviral vector-mediated gene therapy in patients with Wiskott-Aldrich syndrome
Abstract
Background: Wiskott-Aldrich syndrome (WAS) is a severe X-linked immunodeficiency characterized by microthrombocytopenia, eczema, recurrent infections, and susceptibility to autoimmunity and lymphomas. Hematopoietic stem cell transplantation is the treatment of choice; however, administration of WAS gene-corrected autologous hematopoietic stem cells has been demonstrated as a feasible alternative therapeutic approach.
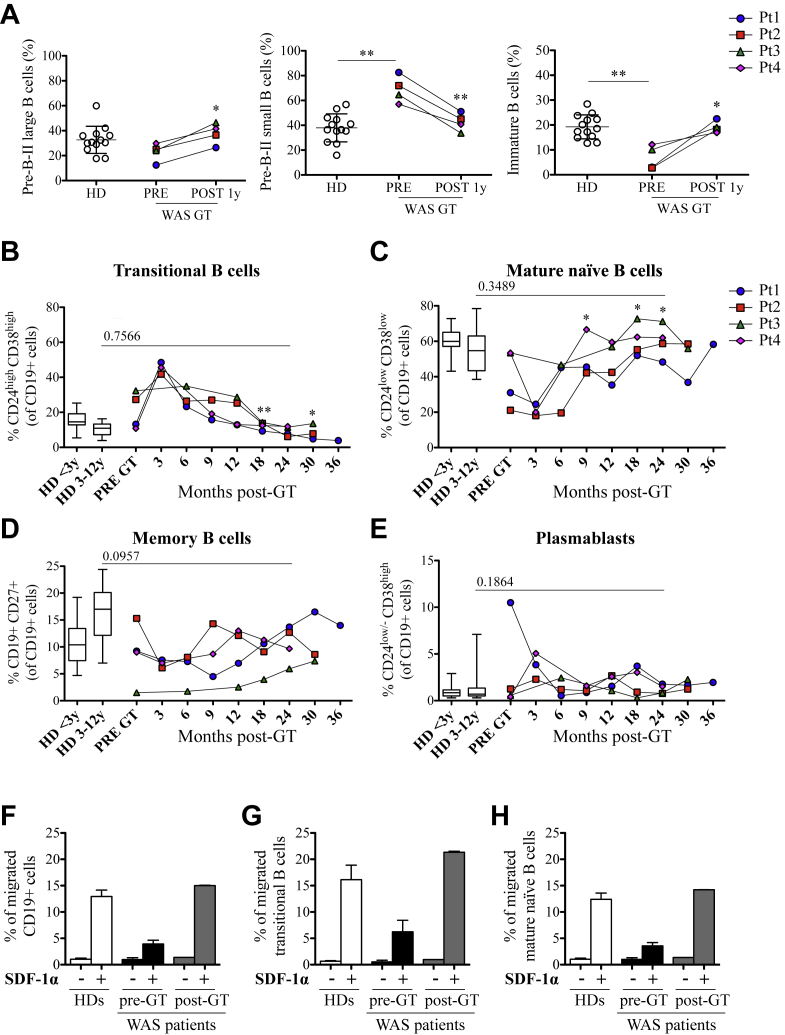
Objective: Because B-cell homeostasis is perturbed in patients with WAS and restoration of immune competence is one of the main therapeutic goals, we have evaluated reconstitution of the B-cell compartment in 4 patients who received autologous hematopoietic stem cells transduced with lentiviral vector after a reduced-intensity conditioning regimen combined with anti-CD20 administration.
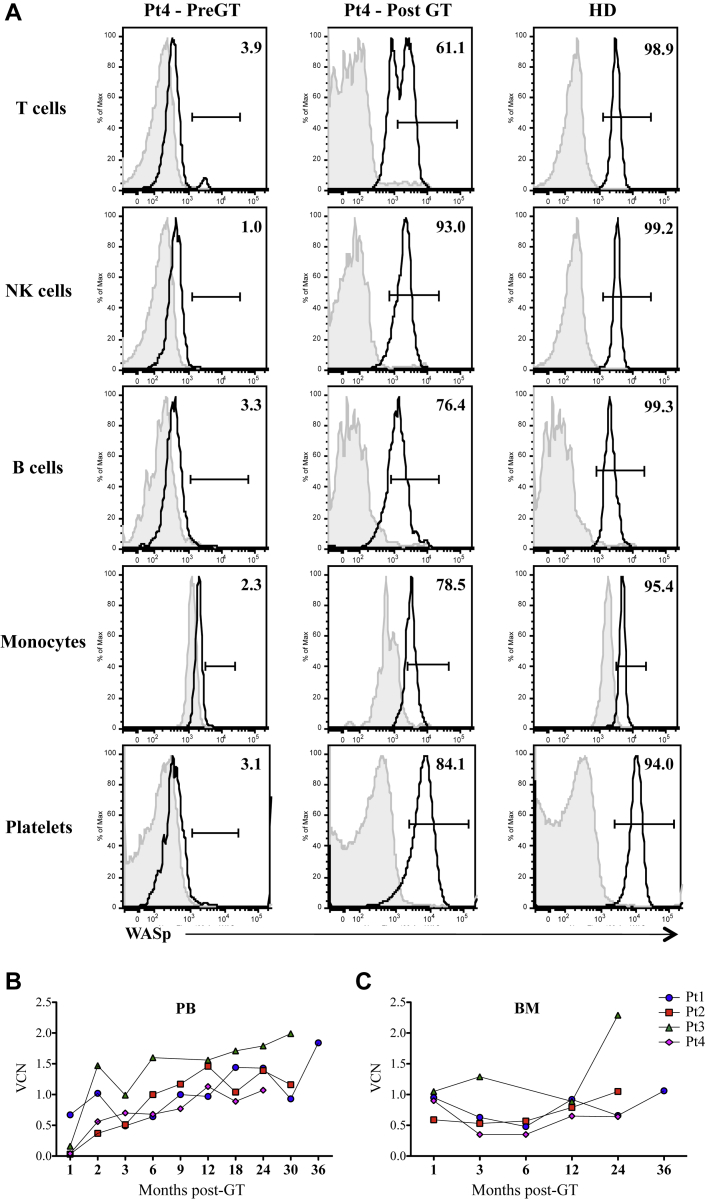
Methods: We evaluated B-cell counts, B-cell subset distribution, B cell-activating factor and immunoglobulin levels, and autoantibody production before and after gene therapy (GT). WAS gene transfer in B cells was assessed by measuring vector copy numbers and expression of Wiskott-Aldrich syndrome protein.
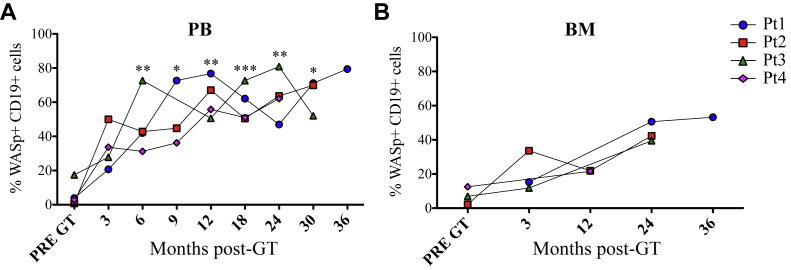
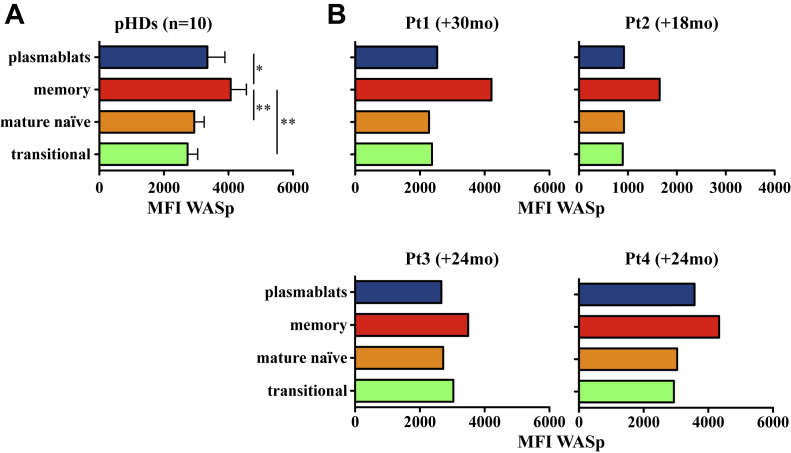
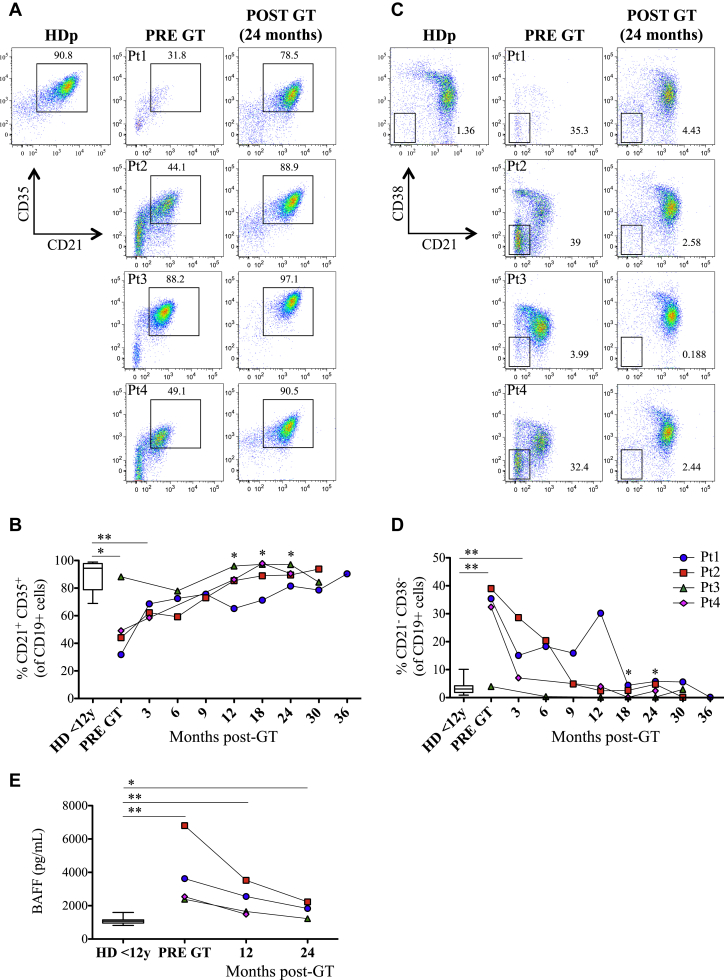
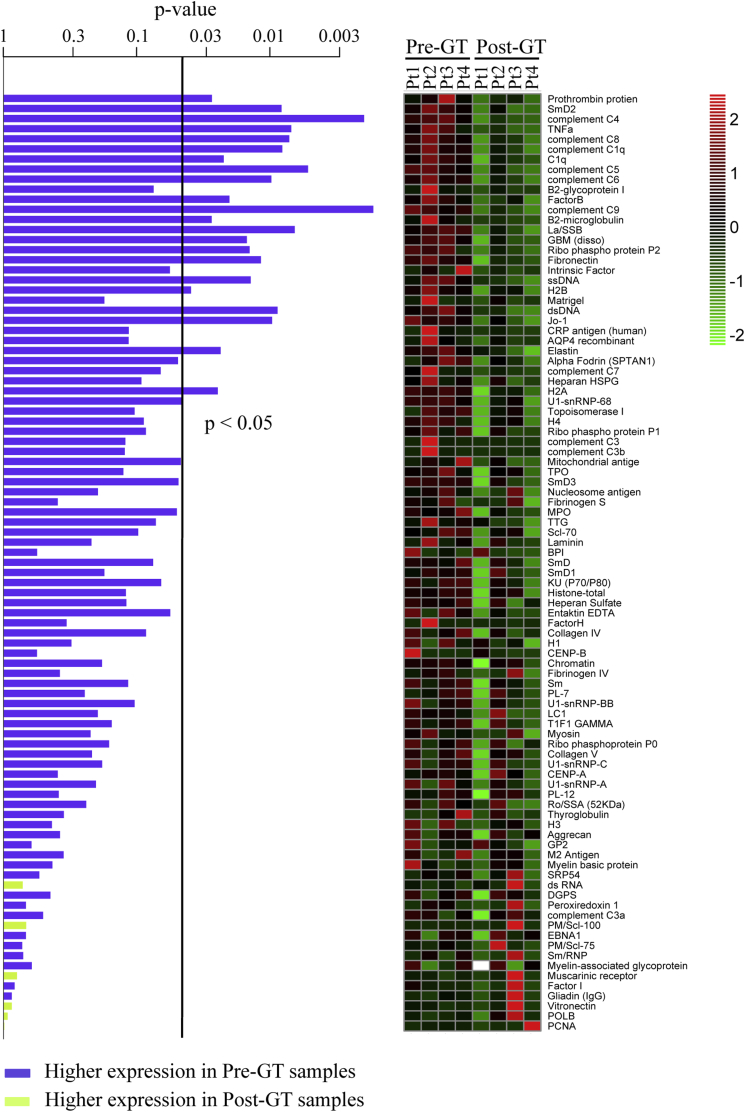
Results: After lentiviral vector-mediated GT, the number of transduced B cells progressively increased in the peripheral blood of all patients. Lentiviral vector-transduced progenitor cells were able to repopulate the B-cell compartment with a normal distribution of B-cell subsets both in bone marrow and the periphery, showing a WAS protein expression profile similar to that of healthy donors. In addition, after GT, we observed a normalized frequency of autoimmune-associated CD19(+)CD21(-)CD35(-) and CD21(low) B cells and a reduction in B cell-activating factor levels. Immunoglobulin serum levels and autoantibody production improved in all treated patients.
Conclusions: We provide evidence that lentiviral vector-mediated GT induces transgene expression in the B-cell compartment, resulting in ameliorated B-cell development and functionality and contributing to immunologic improvement in patients with WAS.
Keywords: B cell; Wiskott-Aldrich syndrome; gene therapy; lentiviral vector; primary immunodeficiency.
Copyright © 2015 The Authors. Published by Elsevier Inc. All rights reserved.
Figures
Similar articles
-
Lentiviral haemopoietic stem/progenitor cell gene therapy for treatment of Wiskott-Aldrich syndrome: interim results of a non-randomised, open-label, phase 1/2 clinical study.Lancet Haematol. 2019 May;6(5):e239-e253. doi: 10.1016/S2352-3026(19)30021-3. Epub 2019 Apr 10. Lancet Haematol. 2019. PMID: 30981783 Free PMC article. Clinical Trial.
-
Lentiviral-mediated gene therapy leads to improvement of B-cell functionality in a murine model of Wiskott-Aldrich syndrome.J Allergy Clin Immunol. 2011 Jun;127(6):1376-84.e5. doi: 10.1016/j.jaci.2011.03.030. Epub 2011 Apr 29. J Allergy Clin Immunol. 2011. PMID: 21531013
-
Wiskott-Aldrich Syndrome protein deficiency perturbs the homeostasis of B-cell compartment in humans.J Autoimmun. 2014 May;50(100):42-50. doi: 10.1016/j.jaut.2013.10.006. Epub 2013 Dec 25. J Autoimmun. 2014. PMID: 24369837 Free PMC article.
-
Development of lentiviral gene therapy for Wiskott Aldrich syndrome.Expert Opin Biol Ther. 2008 Feb;8(2):181-90. doi: 10.1517/14712598.8.2.181. Expert Opin Biol Ther. 2008. PMID: 18194074 Free PMC article. Review.
-
Current and emerging treatment options for Wiskott-Aldrich syndrome.Expert Rev Clin Immunol. 2015;11(9):1015-32. doi: 10.1586/1744666X.2015.1062366. Epub 2015 Jul 9. Expert Rev Clin Immunol. 2015. PMID: 26159751 Review.
Cited by
-
Long-term safety and efficacy of lentiviral hematopoietic stem/progenitor cell gene therapy for Wiskott-Aldrich syndrome.Nat Med. 2022 Jan;28(1):71-80. doi: 10.1038/s41591-021-01641-x. Epub 2022 Jan 24. Nat Med. 2022. PMID: 35075289 Free PMC article.
-
Optimization of lentiviral vector production for scale-up in fixed-bed bioreactor.Gene Ther. 2018 Jan;25(1):39-46. doi: 10.1038/gt.2017.91. Epub 2017 Oct 5. Gene Ther. 2018. PMID: 29345252 Free PMC article.
-
Absence of Replication-Competent Lentivirus in the Clinic: Analysis of Infused T Cell Products.Mol Ther. 2018 Jan 3;26(1):280-288. doi: 10.1016/j.ymthe.2017.09.008. Epub 2017 Sep 12. Mol Ther. 2018. PMID: 28970045 Free PMC article.
-
How I manage patients with Wiskott Aldrich syndrome.Br J Haematol. 2019 May;185(4):647-655. doi: 10.1111/bjh.15831. Epub 2019 Mar 12. Br J Haematol. 2019. PMID: 30864154 Free PMC article. Review.
-
Ex vivo regional gene therapy with human adipose-derived stem cells for bone repair.Bone. 2020 Sep;138:115524. doi: 10.1016/j.bone.2020.115524. Epub 2020 Jul 2. Bone. 2020. PMID: 32622870 Free PMC article.
References
-
- Bosticardo M., Marangoni F., Aiuti A., Villa A., Grazia Roncarolo M. Recent advances in understanding the pathophysiology of Wiskott-Aldrich syndrome. Blood. 2009;113:6288–6295. - PubMed
-
- Symons M., Derry J.M., Karlak B., Jiang S., Lemahieu V., Mccormick F. Wiskott-Aldrich syndrome protein, a novel effector for the GTPase CDC42Hs, is implicated in actin polymerization. Cell. 1996;84:723–734. - PubMed
-
- Huang W., Ochs H.D., Dupont B., Vyas Y.M. The Wiskott-Aldrich syndrome protein regulates nuclear translocation of NFAT2 and NF-kappa B (RelA) independently of its role in filamentous actin polymerization and actin cytoskeletal rearrangement. J Immunol. 2005;174:2602–2611. - PubMed
Publication types
MeSH terms
Substances
Grants and funding
LinkOut - more resources
Full Text Sources
Other Literature Sources
Medical
Miscellaneous
