. 2015 May;25(5):655-66.
doi: 10.1101/gr.181974.114. Epub 2015 Mar 19.

Extensive microRNA-mediated crosstalk between lncRNAs and mRNAs in mouse embryonic stem cells

Affiliations

Extensive microRNA-mediated crosstalk between lncRNAs and mRNAs in mouse embryonic stem cells

Jennifer Y Tan et al. Genome Res. 2015 May.

Erratum in

Abstract

Recently, a handful of intergenic long noncoding RNAs (lncRNAs) have been shown to compete with mRNAs for binding to miRNAs and to contribute to development and disease. Beyond these reports, little is yet known of the extent and functional consequences of miRNA-mediated regulation of mRNA levels by lncRNAs. To gain further insight into lncRNA-mRNA miRNA-mediated crosstalk, we reanalyzed transcriptome-wide changes induced by the targeted knockdown of over 100 lncRNA transcripts in mouse embryonic stem cells (mESCs). We predicted that, on average, almost one-fifth of the transcript level changes induced by lncRNAs are dependent on miRNAs that are highly abundant in mESCs. We validated these findings experimentally by temporally profiling transcriptome-wide changes in gene expression following the loss of miRNA biogenesis in mESCs. Following the depletion of miRNAs, we found that >50% of lncRNAs and their miRNA-dependent mRNA targets were up-regulated coordinately, consistent with their interaction being miRNA-mediated. These lncRNAs are preferentially located in the cytoplasm, and the response elements for miRNAs they share with their targets have been preserved in mammals by purifying selection. Lastly, miRNA-dependent mRNA targets of each lncRNA tended to share common biological functions. Post-transcriptional miRNA-mediated crosstalk between lncRNAs and mRNA, in mESCs, is thus surprisingly prevalent, conserved in mammals, and likely to contribute to critical developmental processes.


Figures

Figure 1.
Figure 1.
MiRNA-dependent regulation of mRNA abundance by lncRNAs. (A) Diagram illustrating the classification of an individual lncRNA's mRNA target as either a competitive endogenous RNA target (ceRNAt) (red) or an miRNA-independent target (dark gray). Red and dark gray arrows represent down- and up-regulation, respectively. (B) Cumulative distribution plots for the density of predicted miRNA response elements (MREs) for the top 25% most highly expressed miRNA families in mESCs shared between lncRNAs and their respective down-regulated targets (median = 2.9 sites/kb of transcript, red) and up-regulated targets (median = 2.3 sites/kb of transcript, black). (C) Transcription factor Pou5f1 (red) is predicted to compete (dotted red arrow) for binding to miR-421 and miR-762 MREs (red oblongs within transcript) with linc1471 (dark gray). MREs for miRNAs not shared between the two genes are represented in light gray. Bar chart represents the number of miRNA-independent targets of linc1471 that are shared with Pou5f1, whose levels changed in the same or opposite direction upon linc1471 (dark gray) or Pou5f1 (red) knockdown. Arrows indicate the direction of the observed expression changes following linc1471 and Pou5f1 knockdown. (***) P < 0.001.
Figure 2.
Figure 2.
The expression levels of lncRNAs and their ceRNAts are positively correlated upon loss of miRNA biogenesis. (A) Loss of miRNA biogenesis (Dcr−/−) is associated with decreased levels, relative to the wild-type control, of mature miR-302a (black), miR-124 (dark gray), and miR-290a-3p (light gray) abundance over a 12-d time course. Fold difference in expression relative to controls was determined using qRT-PCR in triplicate. (B) Long poly(A)-selected RNA from total cellular extracts of DTCM23/49 XY mouse embryonic stem cells (mESCs) was collected on days 0, 4, 8, 10, and 12 following exposure to tamoxifen. Long poly(A)-selected RNA was also collected from the nucleus and cytoplasm of these cells before (0) and 12 d after treatment with tamoxifen. Total RNA used to quantify miRNA expression was extracted before tamoxifen treatment. (C) Median correlation coefficients between lncRNA expression and their respective ceRNAts (red, median R = 0.347) and miRNA-independent targets (dark gray, R = 0.153) over the 12-d time course following loss of miRNA biogenesis. (D) Pearson's correlation between linc1510’s expression (average across replicates of the gene expression measured as fragment per kilobase of exon per million reads mapped [FPKM], x-axis) and the median expression of all of its targets annotated as either ceRNAts (R = 0.66, red) or miRNA-independent targets (R = 0.19, dark gray) at each time point (y-axis). (E) Fold difference in normalized (using Gadph) gene expression following knockdown of linc1405 (square symbols), linc1582 (circles), or linc1283 (triangles) and siRNA transfection control in Dcr+/+ (x-axis) or Dcr−/− (y-axis) mESCs. True and false ceRNA positives are highlighted in red or gray, respectively. Error bars represent S.E.M. across replicates. (***) P < 0.001.
Figure 3.
Figure 3.
lnceRNAs are enriched in the cytoplasm. (A) Ratio between gene expression (in FPKM) in the cytoplasmic and nuclear fraction for lnceRNAs (red, r = 0.555) and lncRNAs that were not annotated as lnceRNAs (gray, r = 0.397). Relative fold difference in expression measured in the cytoplasm (blue) and nucleus (orange) of cells before (day 0) and after (day 12) Dicer1 loss-of-function for ceRNAts and putative ceRNAts of (B) lnceRNAs and (C) non-lnceRNAs. Median fold differences are shown in the corresponding box plot. (NS) Not significant, (*) P < 0.05, (***) P < 0.001.
Figure 4.
Figure 4.
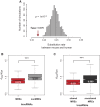
MiRNA response elements shared between lnceRNAs and ceRNAts are conserved through mammalian evolution. (A) Histogram representing the substitution rate between mouse and human for a neutrally evolving sequence in the vicinity of lnceRNA MREs with the same length (ancestral repeats, ARs). Vertical arrow represents the substitution rate estimated for lnceRNA MREs (dMRE = 0.376). (B) Distribution of nucleotide substitution rate normalized by neutral local rate, between mouse and human, for predicted MREs (dMRE/dAR = 0.872, red) and non-MREs (dnonMRE/dAR = 0.977, gray) sequence within lnceRNAs. (C) Distribution of mouse-human substitution rate normalized by neutral local rate, measured at MREs shared between lnceRNAs and their ceRNAts (red, dMRE-shared/dAR = 0.831) and MREs for miRNAs not shared between lnceRNA and their targets (gray, dMRE-nonshared/dAR = 0.900). (***) P < 0.001.
Figure 5.
Figure 5.
ceRNAts of lnceRNAs are functionally related. (A) Distribution of the mean linkage in an integrative functional network (Honti et al. 2014), for ceRNAts (median of mean linkage = 0.534, red) and miRNA-independent targets (median of mean linkage = 0.205, dark gray) of lnceRNAs. (B) Distribution of mean linkage weights for 1000 sets of randomly selected mESC-expressed genes. The red arrow indicates the mean linkage weight for ceRNAts of linc1316. The inset illustrates the connectivity of functional similarities (red edges) within miRNA-dependent target genes (red nodes). (C) Table illustrating Biological Processes Gene Ontology (GO) annotations that are significantly enriched within ceRNAts of linc1316 relative to a background of mESC-expressed genes. (*) P < 0.05.

References

    1. Ala U, Karreth FA, Bosia C, Pagnani A, Taulli R, Leopold V, Tay Y, Provero P, Zecchina R, Pandolfi PP. 2013. Integrated transcriptional and competitive endogenous RNA networks are cross-regulated in permissive molecular environments. Proc Natl Acad Sci 110: 7154–7159. - PMC - PubMed
    1. Ambros V, Bartel B, Bartel DP, Burge CB, Carrington JC, Chen X, Dreyfuss G, Eddy SR, Griffiths-Jones S, Marshall M, et al.2003. A uniform system for microRNA annotation. RNA 9: 277–279. - PMC - PubMed
    1. Ashburner M, Ball CA, Blake JA, Botstein D, Butler H, Cherry JM, Davis AP, Dolinski K, Dwight SS, Eppig JT, et al.2000. Gene Ontology: tool for the unification of biology. Nat Genet 25: 25–29. - PMC - PubMed
    1. Bartel DP. 2004. MicroRNAs: genomics, biogenesis, mechanism, and function. Cell 116: 281–297. - PubMed
    1. Bartel DP 2009. MicroRNAs: target recognition and regulatory functions. Cell 136: 215–233. - PMC - PubMed

Publication types

Associated data