. 2015 Jul;29(7):2912-29.
doi: 10.1096/fj.14-268276. Epub 2015 Mar 19.

Impaired mitophagy leads to cigarette smoke stress-induced cellular senescence: implications for chronic obstructive pulmonary disease

Affiliations

Impaired mitophagy leads to cigarette smoke stress-induced cellular senescence: implications for chronic obstructive pulmonary disease

Tanveer Ahmad et al. FASEB J. 2015 Jul.

Abstract

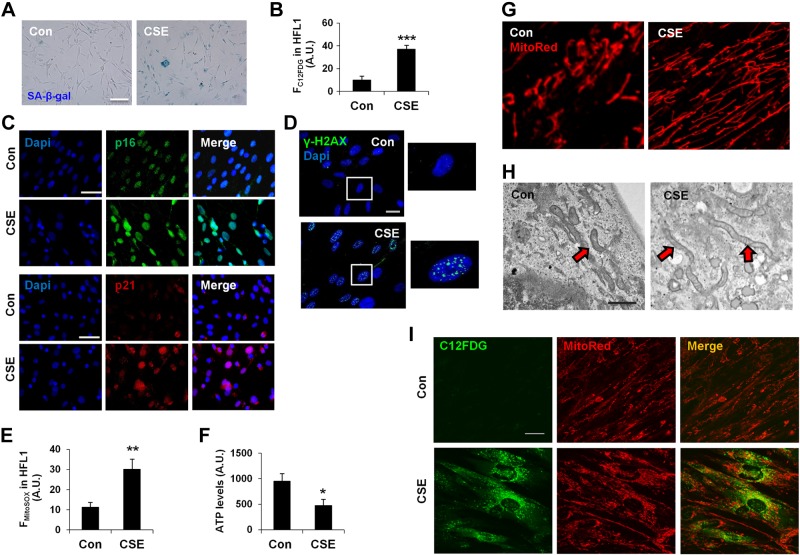
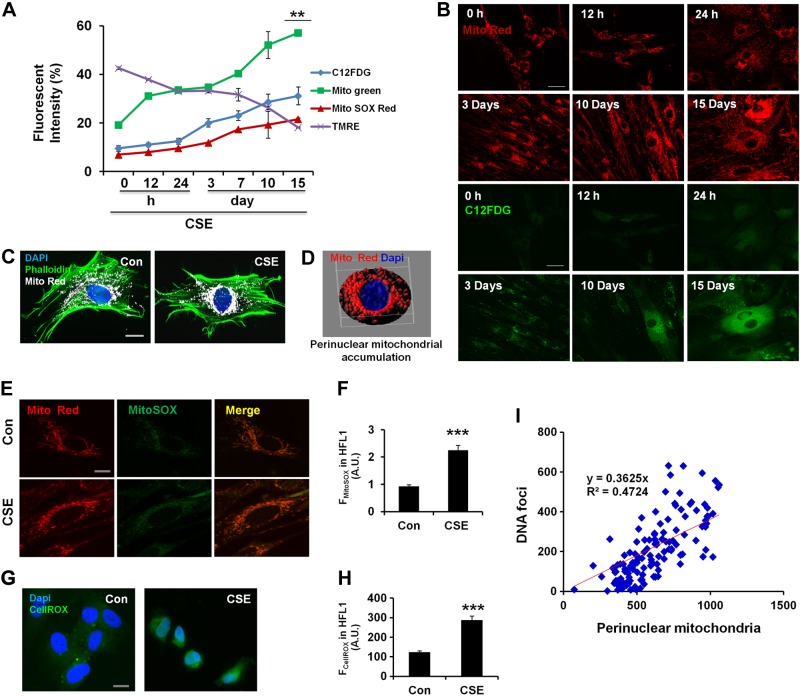
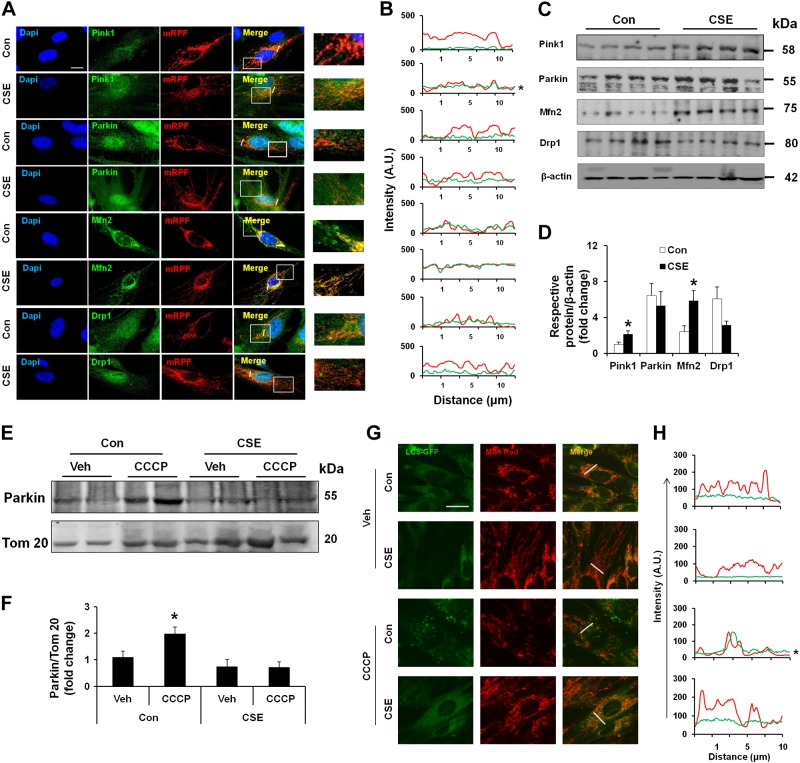
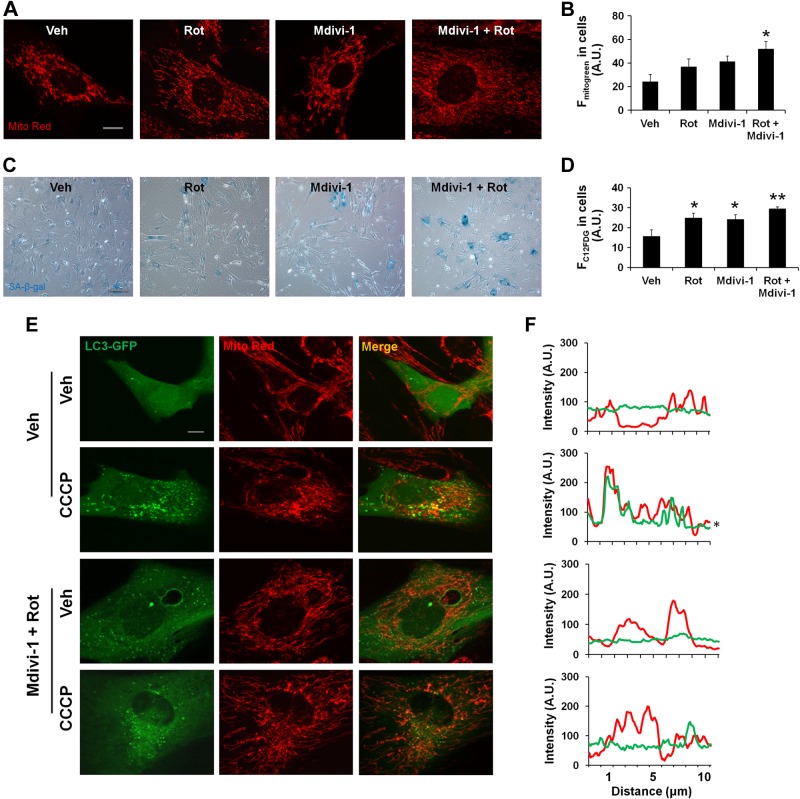
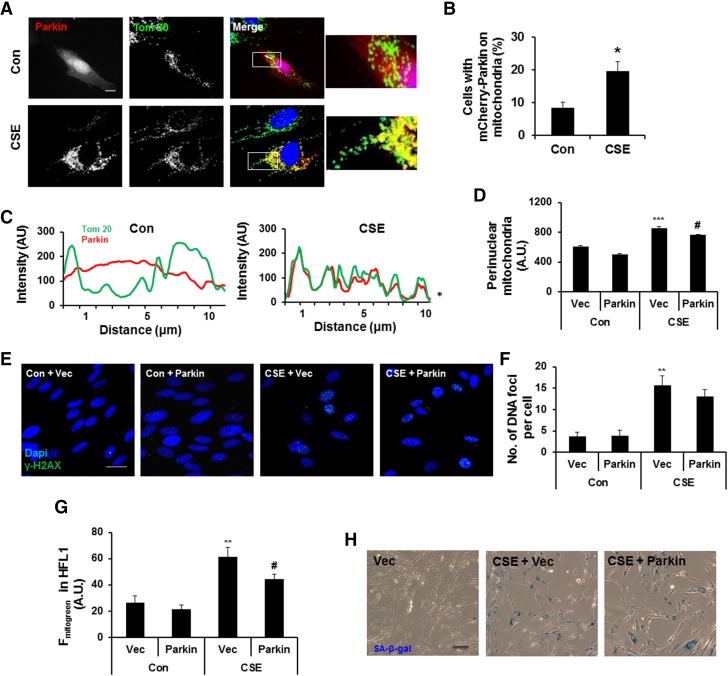
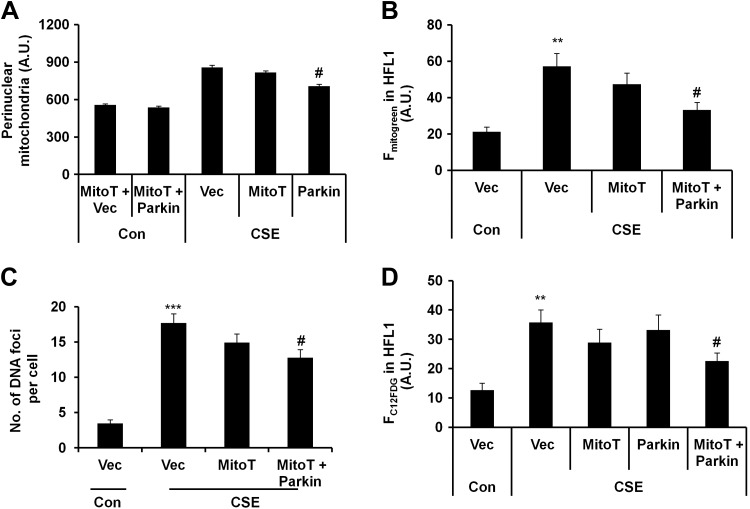
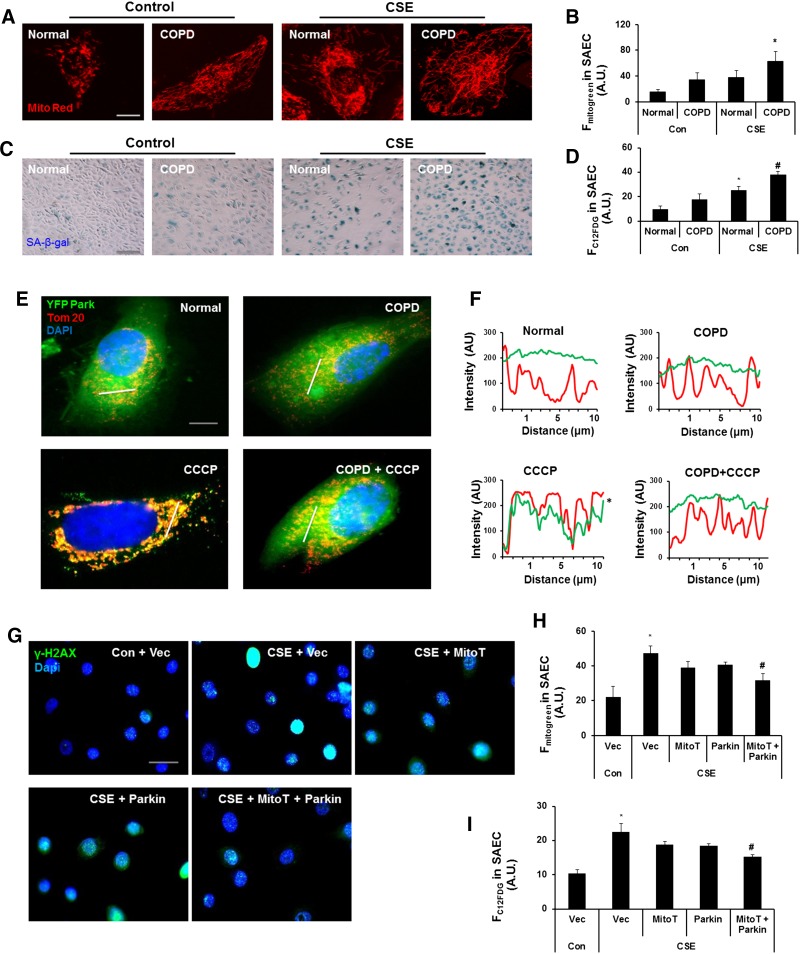
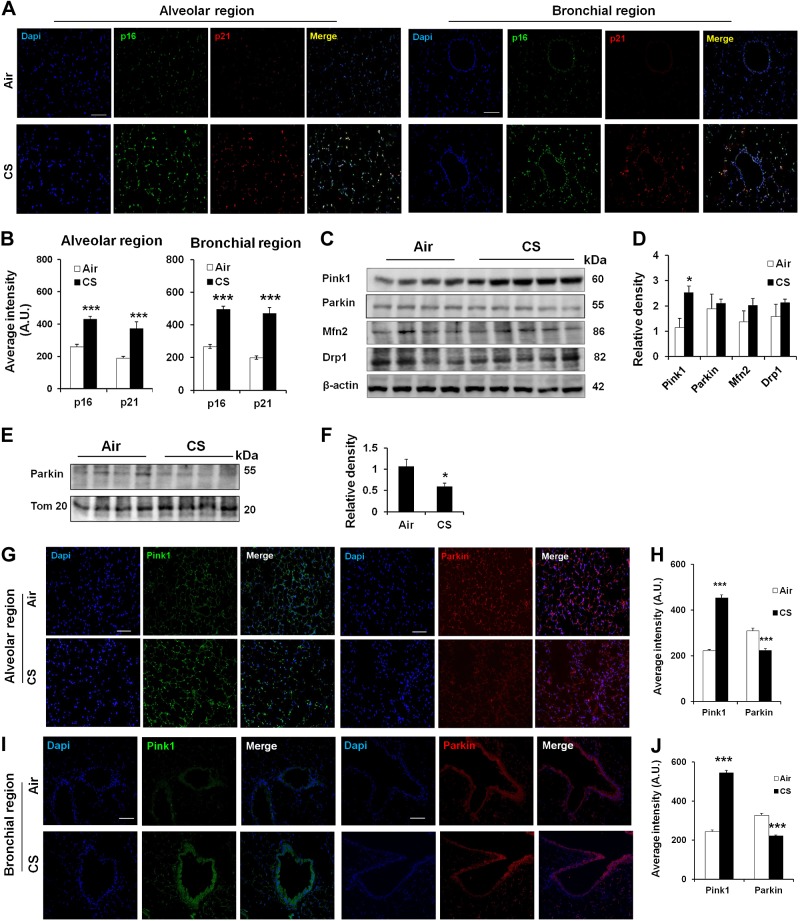
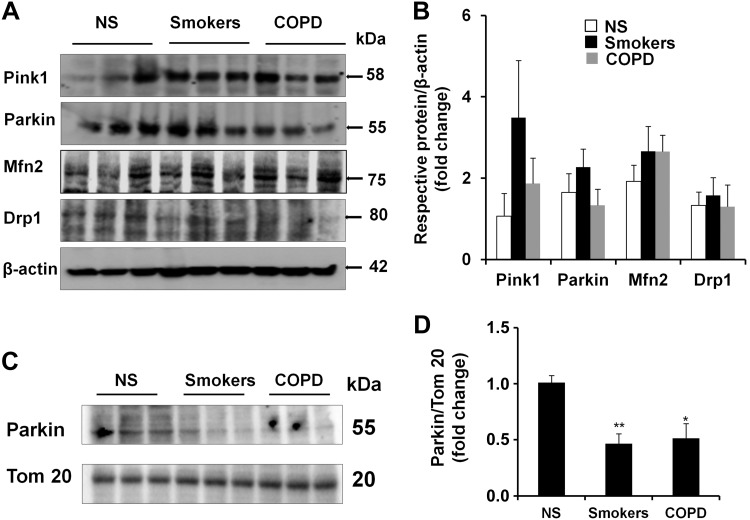
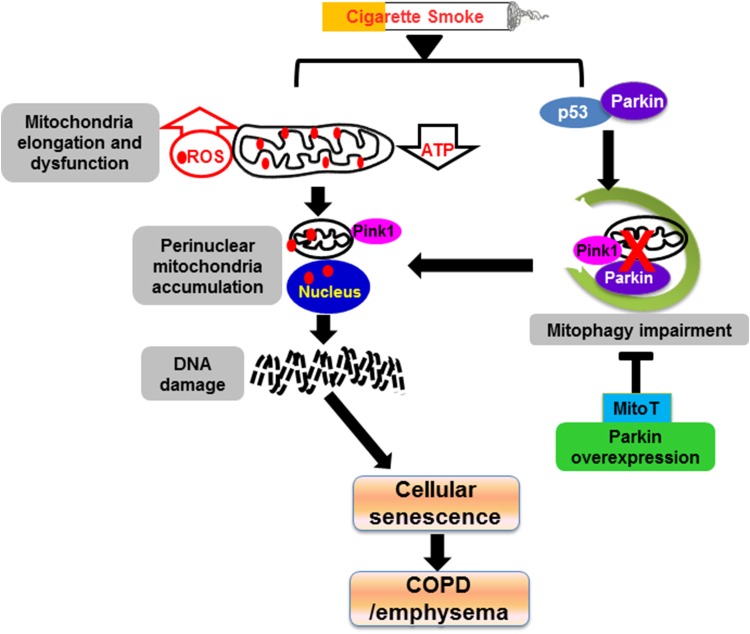
Cigarette smoke (CS)-induced cellular senescence is involved in the pathogenesis of chronic obstructive pulmonary disease (COPD). The molecular mechanism by which CS induces cellular senescence is unknown. Here, we show that CS stress (exposure of primary lung cells to CS extract 0.2-0.75% with a half-maximal inhibitory concentration of ∼0.5%) led to impaired mitophagy and perinuclear accumulation of damaged mitochondria associated with cellular senescence in both human lung fibroblasts and small airway epithelial cells (SAECs). Impaired mitophagy was attributed to reduced Parkin translocation to damaged mitochondria, which was due to CS-induced cytoplasmic p53 accumulation and its interaction with Parkin. Impaired Parkin translocation to damaged mitochondria was also observed in mouse lungs with emphysema (6 months CS exposure, 100 mg TPM/m(3)) as well as in lungs of chronic smokers and patients with COPD. Primary SAECs from patients with COPD also exhibited impaired mitophagy and increased cellular senescence via suborganellar signaling. Mitochondria-targeted antioxidant (Mito-Tempo) restored impaired mitophagy, decreased mitochondrial mass accumulation, and delayed cellular senescence in Parkin-overexpressing cells. In conclusion, defective mitophagy leads to CS stress-induced lung cellular senescence, and restoring mitophagy delays cellular senescence, which provides a promising therapeutic intervention in chronic airway diseases.

Keywords: DNA damage; Parkin; Pink1; perinuclear mitochondrial clustering; reactive oxygen species.


Figures

Figure 1.
Figure 1.
CSE causes cellular senescence and mitochondrial dysfunction in lung fibroblasts. A) Representative images of SA-β-gal activity in HLFs (HFL1) with and without CSE. Con, control. B) C12FDG fluorescence in HFL1 cells was measured by FACS and plotted as average fluorescent intensity (FC12FDG in HFL1), which showed the degree of cellular senescence in arbitrary units (A.U.). ***P < 0.001 vs. control. C) Representative images of p16 and p21 immunofluorescence in HFL1 cells with and without CSE (as above). D) Representative images of HFL1 cells stained with γ-H2AX (green), whereas DAPI (blue) was used to label nucleus. Areas in squares are enlarged as shown on right panel. E) mtROS measurement by FACS and plotted as mean fluorescence intensity (FMitoSOX) in HFL1. **P < 0.01 vs. control. F) ATP level measurement in cells with equal cell numbers. *P < 0.05 vs. control. G) Representative images show mitochondrial morphology in HFL1 cells stained with MitoTracker Red (MitoRed) using confocal microscopy, and the images are digitally zoomed. H) Electron microscopy images of HFL1 cells showing mitochondrial morphologic changes. I) Representative images of mitochondrial morphologic changes in senescent HFL1 cells as shown by colocalization of MitoTracker Red with a senescence marker, C12FDG (green). CSE was used at 0.5% with alternate day treatment for 15 days. Data are shown as the means ± sem (n = 3–4). Scale bars, 10 µm (A), 20 µm (C, D, and I), and 0.5 μm (H).
Figure 2.
Figure 2.
CSE induces perinuclear mitochondrial accumulation and DNA damage in lung fibroblasts. A) Time kinetic experiment shows correlation among cellular senescence (C12FDG), mtROS (MitoSOX Red), ΔΨm (TMRM), and mitochondrial mass (MitoGreen) in HFL1 cells. **P < 0.01 vs. 0 hours. B) Representative images show mitochondrial structural changes during cellular senescence in HFL1 cells treated with 0.5% CSE at indicated time points. HFL1 cells were stained with MitoTracker Red (Mito Red), and C12FDG (green) was used to label senescent cells. C) Representative images show perinuclear mitochondrial accumulation in HFL1 cells treated with CSE (0.75%) for 24 hours. Mitochondria were stained with MitoTracker Red (white), phalloidin (catalog number A12380; Life Technologies) for actin (green), and DAPI for nucleus (blue). Con, control. D) 3D representation of perinuclear mitochondrial clustering during CSE treatment (mitochondria as red and nucleus as blue) using ImageJ. E) Representative images of MitoSOX red (green) and mitochondria stained with MitoTracker Red. Cells were treated with CSE (0.75%) for 24 hours before imaging. F) Data were plotted as average fluorescent intensity (FMitoSOX) of MitoSOX, which was measured by FACS in HFL1. A.U., arbitrary units. ***P < 0.001 vs. control. G) Representative images of CellROX for the measurement of ROS. HFL1 cells were treated with or without CSE (0.75%) for 24 hours and stained with CellROX (green) and DAPI (blue) to visualize the ROS in the nucleus. H) Average fluorescent intensity (FCellROX) of CellROX as measured in HFL1 cells using the MetaMorph software. ***P < 0.001 vs. control. I) Correlation data between perinuclear mitochondrial accumulation and DNA foci formation. HFL1 cells were stained with Tom 20 for mitochondria and DAPI for nucleus to visualize perinuclear mitochondria, along with γ-H2AX for DNA damage foci. Data are shown as the means ± sem (n = 3–4). Scale bars, 20 μm (B, C, E, and G).
Figure 3.
Figure 3.
CSE treatment leads to mitophagy impairment in lung fibroblasts. A) Representative images of Pink1, Parkin, Mfn2, and Drp1 (green) in HFL1 cells treated with or without CSE. Cells were transfected with mitochondria-targeted red fluorescent protein (mRPF; red) (CellLight Mitochondria-RFP, BacMam, catalog number C10505; Cell Technologies) for 24 hours before staining with respective antibodies (green) and DAPI (blue). Areas in squares are enlarged as shown on right panel. Slanting lines on images indicate the areas assessed for fluorescence intensity. Con, control. B) Line scan data of fluorescence intensity in the corresponding images to show the degree of colocalization between mRFP (mitochondria) and the respective proteins. A.U., arbitrary units. *P < 0.05 vs. control. C) Western blots of Pink1, Parkin, Mfn2, and Drp1 in whole-cell extracts prepared from HFL1 cells treated with or without CSE. β-Actin (catalog number R-22 sc-130657; Santa Cruz Biotechnology, Santa Cruz, CA, USA) was used as a loading control. Representative housekeeping loading control is shown. D) Densitometry of the respective blots. *P < 0.05 vs. control. E) Western blot of Parkin in mitochondrial extracts from HFL1 cells with or without CSE treatment. CCCP was used as a positive control to induce Parkin mitochondrial translocation. Tom 20 was used as a loading control. Veh, vehicle. F) Densitometry of the respective blots. *P < 0.05 vs. vehicle. G) Representative images of LC3-GFP (CellLight Mitochondria-GFP, BacMam, catalog number C10600; Life Technologies) expressing HFL1 cells stained with MitoTracker Red. Cells were treated with CSE (0.5%) for 15 days followed by CCCP treatment for 2 hours. Images show the colocalization of LC3-GFP with mitochondria (Mito Red) after CCCP treatment. Slanting lines on images indicate the areas assessed for fluorescence intensity. H) Corresponding line scan of fluorescence intensity shows the colocalization of LC3-GFP with mitochondria (red). *P < 0.05 vs. control. CSE was used at 0.5% with alternate day treatment for 15 days. Data are shown as the means ± sem (n = 3–4). Scale bars, 20 μm (A and G).
Figure 4.
Figure 4.
Accumulation of damaged mitochondria leads to cellular senescence in lung fibroblasts. A) Representative images of mouse lung fibroblasts show mitochondrial elongation and accumulation of mitochondrial mass with rotenone (Rot) and Mdivi-1 treatment. Rotenone (10 nM), Mdivi-1 (1 µM), and their combination for 15 days with alternate day treatment are shown. Veh, vehicle. B) Average fluorescent intensity of MitoTracker Green (Fmitogreen) reflects mitochondrial mass, measured by FACS in mouse lung fibroblasts. A.U., arbitrary units. *P < 0.05 vs. vehicle. C) Representative images of SA-β-gal activity in mouse lung fibroblasts with and without rotenone (10 nM), Mdivi-1 (1 µM), and combination treatment. D) C12FDG fluorescence in mouse lung fibroblasts was measured by FACS and plotted as average fluorescent intensity (FC12FDG in cells), which showed the degree of cellular senescence in arbitrary units. *P < 0.05 and **P < 0.01 vs. vehicle. E) Representative images of mouse lung fibroblasts show colocalization of LC3-GFP with mitochondria (Mito Red). Vehicle or rotenone- and Mdivi-1-treated cells were further treated with or without CCCP for 2 hours before imaging. F) Line scan of fluorescence intensity in the corresponding images. *P < 0.05 vs. control. Data are shown as the means ± sem (n = 3–4). Scale bars, 10 μm (A and E) and 100 μm (C).
Figure 5.
Figure 5.
Parkin overexpression reduces CS-induced mitophagy impairment in lung fibroblasts. A) Representative images of HFL1 cells transfected with mCherry-Parkin. Cells were treated with CSE (0.75%) for 24 hours and stained with Tom 20 for mitochondria (green). Con, control. Areas in squares are zoomed as shown on right panel. Slanting lines on images indicate the areas assessed for fluorescence intensity. B) Percentage of cells with mCherry-Parkin on mitochondria. *P < 0.05 vs. control. C) Line scan of the corresponding images. AU, arbitrary units. *P < 0.05 vs. control. D) Perinuclear mitochondrial accumulation in HFL1 cells treated with or without CSE (0.75%) for 24 hours. ***P < 0.001 vs. vector (Vec); #P < 0.05 vs. CSE plus vector. E) Representative images of DNA damage foci (reflected by γH2AX foci) in vector or Parkin-overexpressing HFL1 cells (Parkin), treated with or without CSE. DAPI (blue) was used to label nucleus and γ-H2AX for DNA damage foci (green). F) Average number of DNA damage foci per cell. G) Average fluorescence intensity of MitoTracker Green (Fmitogreen), which was measured by FACS in HFL1. **P < 0.01 vs. vector; #P < 0.05 vs. CSE plus vector. H) Representative images of SA-β-gal activity in vector or Parkin-overexpressing HFL1 cells treated with or without alternate day of CSE for 15 days (0.5%). Vec represents the cells transfected with vector only, whereas Parkin represents the cells transfected with mCherry-Parkin plasmid. Data are shown as the means ± sem (n = 3–4). Scale bars, 20 μm (A and E) and 100 μm (H).
Figure 6.
Figure 6.
Mitochondria-targeted antioxidant attenuates mitochondrial mass accumulation and cellular senescence in Parkin-overexpressing HFL1 cells. A) Perinuclear mitochondrial accumulation was measured by FACS in HFL1 cells overexpressing Parkin (Parkin), which were treated with or without CSE (0.75%) for 24 hours. Average intensity of perinuclear mitochondrial accumulation was plotted. A.U., arbitrary units; Con, control. #P < 0.001 vs. CSE plus vector (Vec). B) Average fluorescent intensity of MitoTracker Green (Fmitogreen) was measured by FACS in HFL1 cells treated with or without CSE (0. 5%) for 15 days. **P < 0.01 vs. control vector; #P < 0.05 vs. CSE plus vector. C) Data show number of DNA damage foci per cell in γ-H2AX-stained HFL1 cells that were treated with or without CSE (0.75%) for 24 hours. ***P < 0.001 vs. control vector; #P < 0.05 vs. CSE plus vector. Average number of DNA damage foci per cell was plotted by counting >50 cells. D) FACS data show degree of cellular senescence in cells treated with or without CSE (0.5%) for 15 days. Average fluorescent intensity of C12FDG (FC12FDG in HFL1) was plotted. **P < 0.001 vs. control vector; #P < 0.05 vs. CSE plus vector. Vec represents the cells transfected with vector only, whereas Parkin represents the cells transfected with mCherry-Parkin plasmid, and MitoT represents the cells treated with Mito-Temp. Data are shown as the means ± sem (n = 4).
Figure 7.
Figure 7.
Parkin overexpression and MitoT rescue defective mitophagy and protect human primary SAECs against CS-induced cellular senescence. A) Representative images of cells show mitochondrial morphology in human primary SAECs treated with or without CSE (0.2%) for 10 days with alternate day treatment. Cells were stained with MitoTracker Red for mitochondria. B) Average MitoTracker Green fluorescence (Fmitogreen) was measured by FACS in normal and COPD SAECs treated with or without CSE (0. 2%) for 10 days. A.U., arbitrary units. *P < 0.05 vs. Normal. C) Representative images show SA-β-gal activity in SAECs treated with or without CSE. Cells were treated for 10 days followed by staining with SA-β-gal. D) Average fluorescent intensity of C12FDG (FC12FDG) was measured by FACS in SAECs. Con, control. *P < 0.05 vs. Con-Normal; #P < 0.05 vs. Con-COPD. E) Representative images of normal and COPD cells that were transfected with YFP-Parkin and treated with CCCP (10 µM) for 2 hours. SAECs were stained with Tom 20 (red) and DAPI (blue). Slanting lines on images indicate the areas assessed for fluorescence intensity. F) Corresponding line scan of fluorescence intensity shows the colocalization of YFP-Parkin with mitochondria. *P < 0.05 vs. Normal. G) Representative images of SAECs from normal subjects stained with γ-H2AX (green); DAPI was used to label nucleus (blue). Vec, vector. H) Average MitoTracker Green fluorescence (Fmitogreen) was measured by FACS in SAECs treated with or without CSE (0. 2%) for 15 days. *P < 0.05 vs. control vector; #P < 0.05 vs. CSE plus vector. I) Average fluorescent intensity of C12FDG (FC12FDG) was measured by FACS in SAECs. *P < 0.05 vs. control vector; #P < 0.05 vs. CSE plus vector. Vec is a vector, MitoT represents cells treated with MitoT, and Parkin represents cells transfected with mCherry-Parkin, whereas MitoT + Parkin represents cells transfected with Parkin and treated with MitoT with or without CSE (0.2%) treatment for 15 days. Data are shown as the means ± sem (n = 3). Scale bars, 10 μm (A and E), 100 μm (C), and 20 μm (G).
Figure 8.
Figure 8.
Chronic CS induces impaired mitophagy in mouse lungs with emphysema. A) Representative images of alveolar and bronchial regions show p16 and p21 staining in mouse lungs exposed to CS for 6 months. Tissues were stained with p16 (green), p21 (red), and DAPI (blue). B) Average intensity of p16 and p21 was calculated using MetaMorph software. A.U., arbitrary units. ***P < 0.001 vs. Air. C) Western blot of Pink1, Parkin, Mfn2, and Drp1 in whole-cell extracts prepared from mouse lungs, and β-actin was used as a loading control. Representative housekeeping loading control is shown. D) Densitometry of the respective blots. *P < 0.05 vs. Air. E) Western blot of Parkin and Tom 20 in mitochondrial extracts prepared from lungs of mice exposed to CS for 6 months. Representative loading control is shown. F) Densitometry of the respective blots. *P < 0.05 vs. Air. G and I) Representative images of alveolar and bronchial regions show Pink1 and Parkin staining in mouse lungs. Air is the control group, and CS represents the mice exposed to CS for 6 months. Tissues were stained with Pink1 (green), Parkin (red), and DAPI (blue). H and J) Average intensity of Pink1 and Parkin staining was calculated using MetaMorph software. ***P < 0.001 vs. Air. Data are shown as the means ± sem (n = 3–4). Scale bars, 50 μm (A, G, and I).
Figure 9.
Figure 9.
Impaired mitophagy in lungs of smokers and patients with COPD. A) Western blots of Pink1, Parkin, Mfn2, and Drp1 in whole-cell extracts prepared from human lungs are shown, whereas β-actin was used as a loading control. Representative housekeeping loading control is shown. NS, nonsmokers. B) Densitometry of the respective blots. C) Western blots of Parkin and Tom 20 in mitochondrial extracts prepared from lungs of nonsmokers, smokers, and patients with COPD. Representative loading control is shown. D) Densitometry of the respective blots. *P < 0.05 and **P < 0.01 vs. nonsmokers. Data are represented as the means ± sem (n = 3–4).
Figure 10.
Figure 10.
Schematic diagram shows that CS induces mitochondrial dysfunction and mitophagy impairment leading to cellular senescence via suborganellar signaling in COPD. CS stress causes mitochondrial elongation and dysfunction (i.e., ATP reduction and increased ROS release), leading to perinuclear accumulation of damaged mitochondria and DNA damage-initiated cellular senescence via suborganellar signaling during the development of COPD. CS exposure also increases the interaction of p53 with Parkin, which impairs Parkin-dependent mitophagy and further augments perinuclear mitochondrial clustering. Parkin overexpression along with MitoT treatment reduces mitophagy impairment and cellular senescence. Red dots indicate ROS.

References

    1. Nyunoya T., Monick M. M., Klingelhutz A., Yarovinsky T. O., Cagley J. R., Hunninghake G. W. (2006) Cigarette smoke induces cellular senescence. Am. J. Respir. Cell Mol. Biol. 35, 681–688 - PMC - PubMed
    1. Nyunoya T., Monick M. M., Klingelhutz A. L., Glaser H., Cagley J. R., Brown C. O., Matsumoto E., Aykin-Burns N., Spitz D. R., Oshima J., Hunninghake G. W. (2009) Cigarette smoke induces cellular senescence via Werner’s syndrome protein down-regulation. Am. J. Respir. Crit. Care Med. 179, 279–287 - PMC - PubMed
    1. Hwang J. W., Yao H., Caito S., Sundar I. K., Rahman I. (2013) Redox regulation of SIRT1 in inflammation and cellular senescence. Free Radic. Biol. Med. 61, 95–110 - PMC - PubMed
    1. Hara H., Araya J., Takasaka N., Fujii S., Kojima J., Yumino Y., Shimizu K., Ishikawa T., Numata T., Kawaishi M., Saito K., Hirano J., Odaka M., Morikawa T., Hano H., Nakayama K., Kuwano K. (2012) Involvement of creatine kinase B in cigarette smoke-induced bronchial epithelial cell senescence. Am. J. Respir. Cell Mol. Biol. 46, 306–312 - PubMed
    1. Nyunoya T., Mebratu Y., Contreras A., Delgado M., Chand H. S., Tesfaigzi Y. (2014) Molecular processes that drive cigarette smoke-induced epithelial cell fate of the lung. Am. J. Respir. Cell Mol. Biol. 50, 471–482 - PMC - PubMed

Publication types

MeSH terms