

Graphical display of diagnostic test results in electronic health records: a comparison of 8 systems
- PMID: 25792704
- PMCID: PMC4482275
- DOI: 10.1093/jamia/ocv013
Graphical display of diagnostic test results in electronic health records: a comparison of 8 systems
Abstract
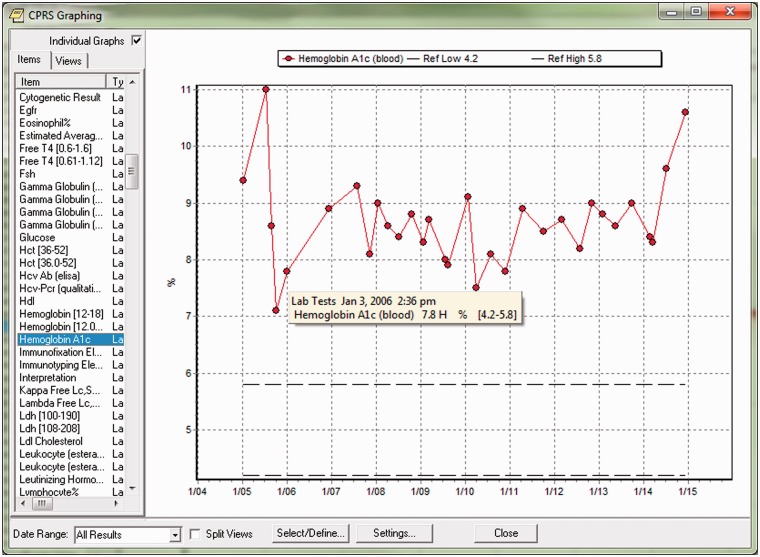
Accurate display and interpretation of clinical laboratory test results is essential for safe and effective diagnosis and treatment. In an attempt to ascertain how well current electronic health records (EHRs) facilitated these processes, we evaluated the graphical displays of laboratory test results in eight EHRs using objective criteria for optimal graphs based on literature and expert opinion. None of the EHRs met all 11 criteria; the magnitude of deficiency ranged from one EHR meeting 10 of 11 criteria to three EHRs meeting only 5 of 11 criteria. One criterion (i.e., the EHR has a graph with y-axis labels that display both the name of the measured variable and the units of measure) was absent from all EHRs. One EHR system graphed results in reverse chronological order. One EHR system plotted data collected at unequally-spaced points in time using equally-spaced data points, which had the effect of erroneously depicting the visual slope perception between data points. This deficiency could have a significant, negative impact on patient safety. Only two EHR systems allowed users to see, hover-over, or click on a data point to see the precise values of the x-y coordinates. Our study suggests that many current EHR-generated graphs do not meet evidence-based criteria aimed at improving laboratory data comprehension.
Keywords: diagnostic tests; electronic health records; national health policy; user computer interface.
© The Author 2015. Published by Oxford University Press on behalf of the American Medical Informatics Association.
Figures


References
-
- Hatch O, Bennett M. A bill to amend the Federal Food, Drug, and Cosmetic Act to provide for the regulation of patient records and certain decision support software. http://assets.fiercemarkets.com/public/healthit/medtechact.pdf. Accessed March 5, 2015.
-
- Federal Register. Part III Department of Health and Human Services 45 CFR Part 170 Establishment of the Permanent Certification for Health Information Technology; Final Rule Vol. 76, No. 5, January 7, 2011. - PubMed
-
- Brown SH, Lincoln MJ, Groen PJ, Kolodner RM. VistA–U.S. Department of Veterans Affairs national-scale HIS. Int J Med Inform. 2003;69(2–3):135–156. - PubMed
-
- Cleveland WS. The Elements of Graphing Data. Monterey, CA: Wadsworth Advanced Books and Software; 1985.
Publication types
MeSH terms
Grants and funding
LinkOut - more resources
Full Text Sources
Other Literature Sources
Medical
Miscellaneous
