. 2015 May 15;290(20):12614-29.
doi: 10.1074/jbc.M115.642777. Epub 2015 Mar 19.

Crystal structure of barley limit dextrinase-limit dextrinase inhibitor (LD-LDI) complex reveals insights into mechanism and diversity of cereal type inhibitors

Affiliations

Crystal structure of barley limit dextrinase-limit dextrinase inhibitor (LD-LDI) complex reveals insights into mechanism and diversity of cereal type inhibitors

Marie S Møller et al. J Biol Chem. .

Abstract

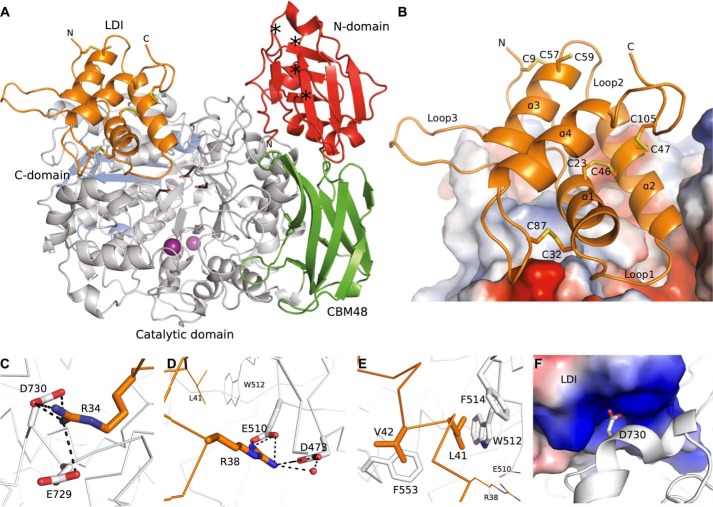
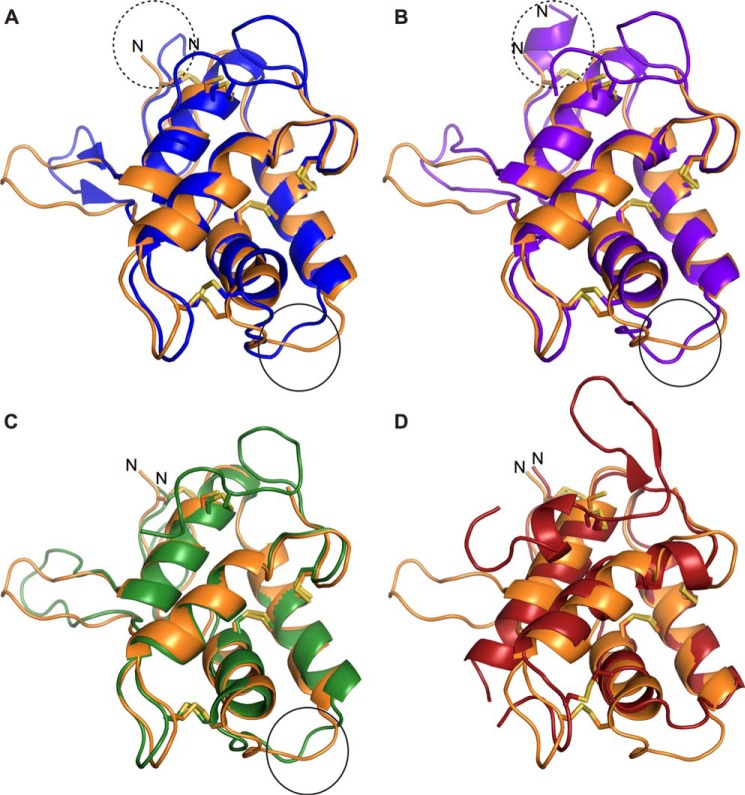
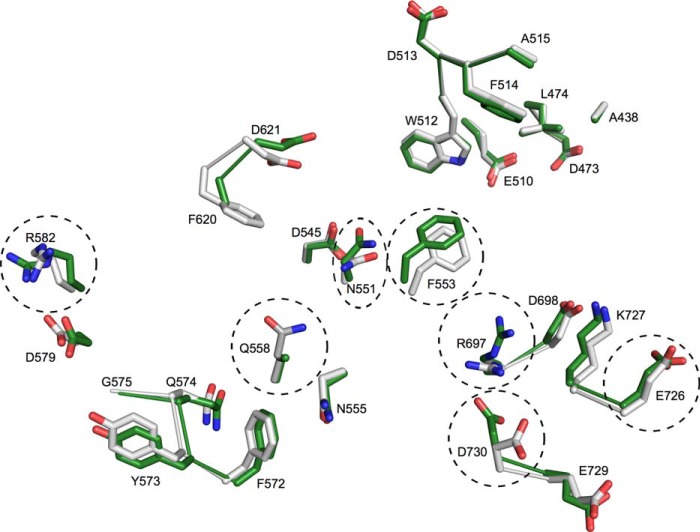
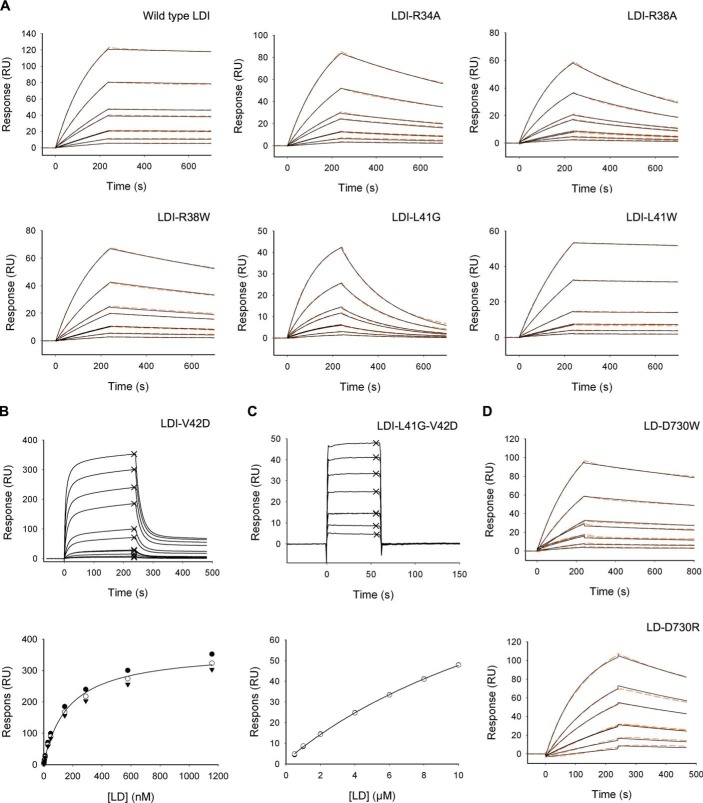
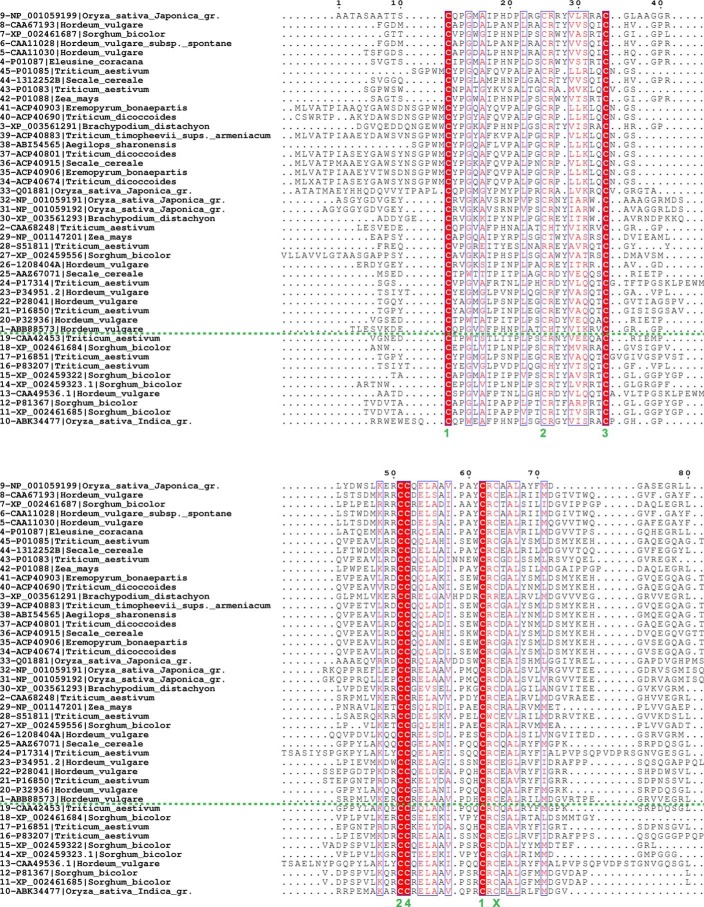
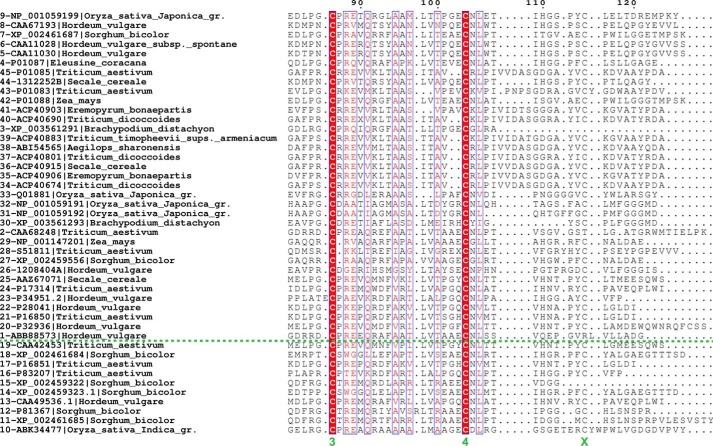
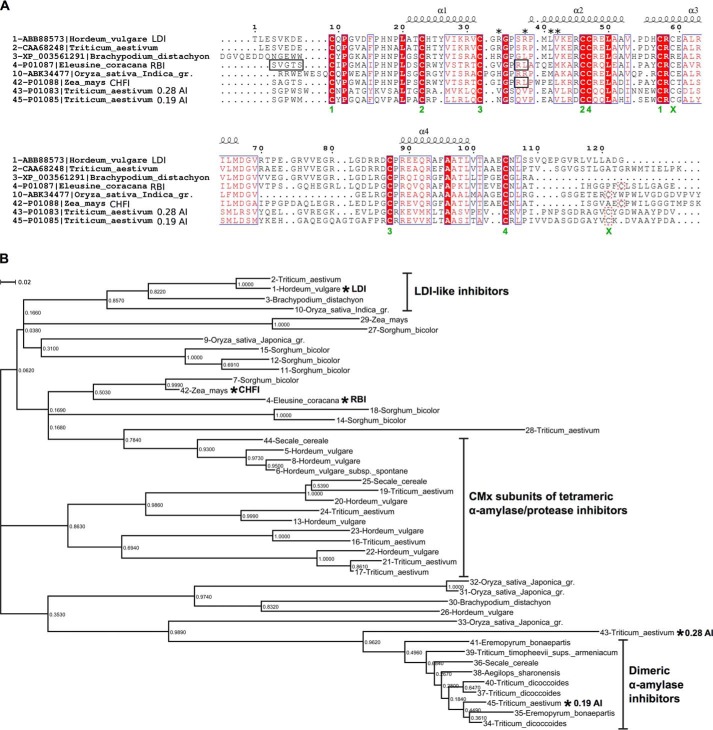
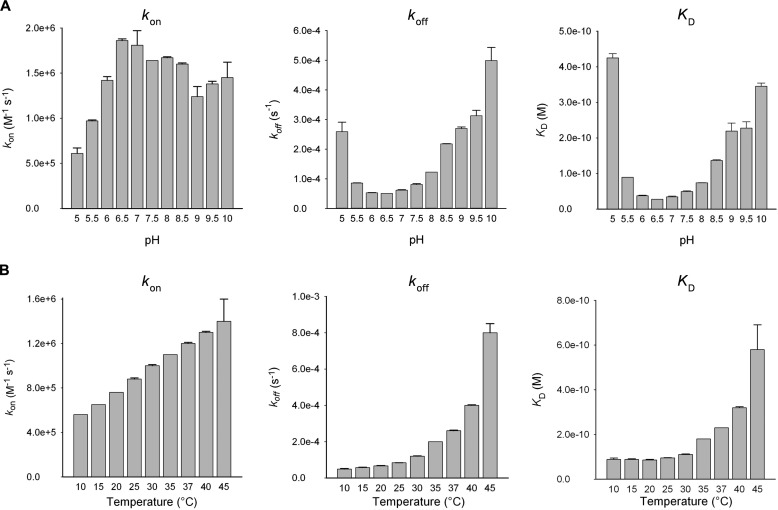
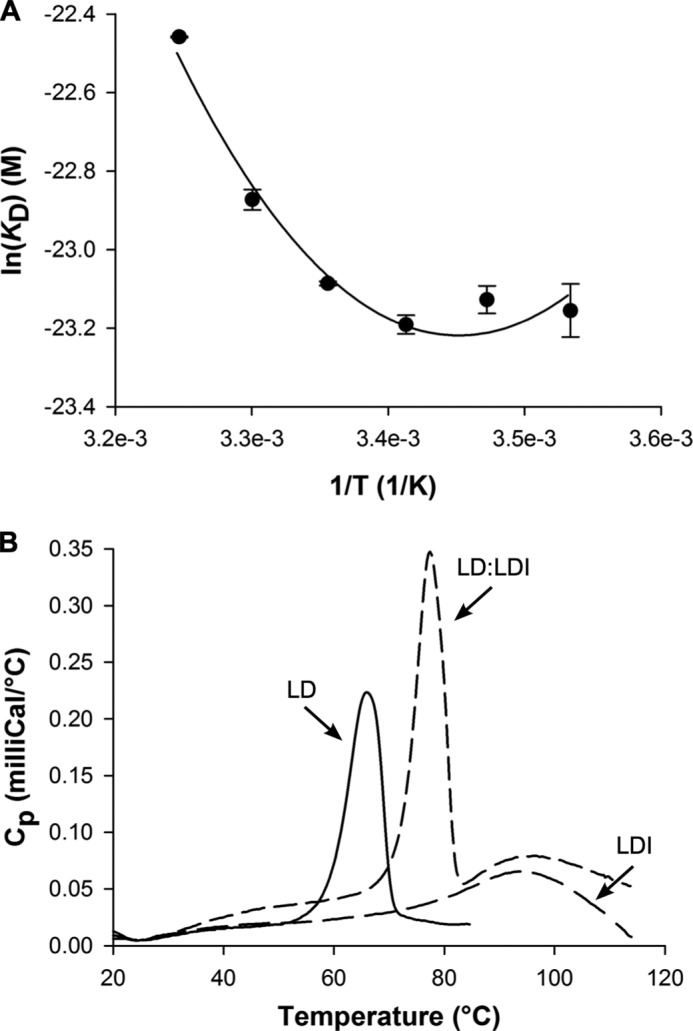
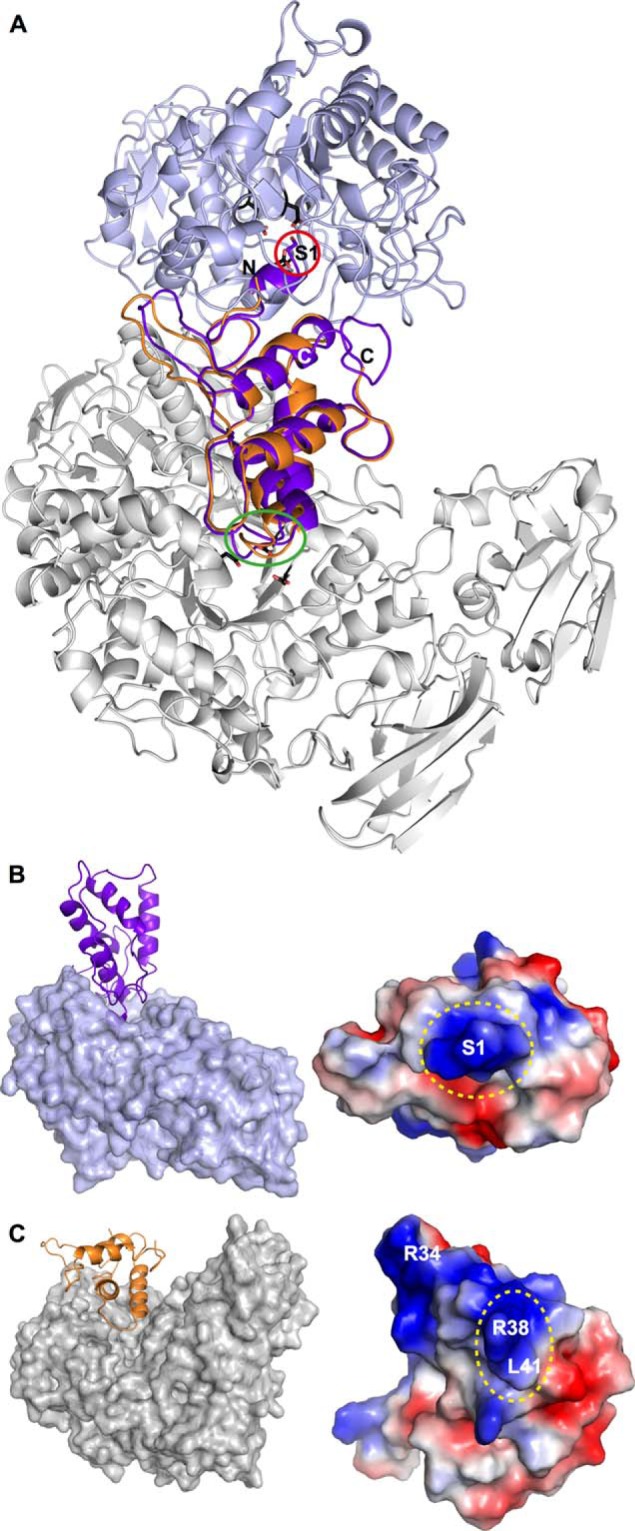
Molecular details underlying regulation of starch mobilization in cereal seed endosperm remain unknown despite the paramount role of this process in plant growth. The structure of the complex between the starch debranching enzyme barley limit dextrinase (LD), hydrolyzing α-1,6-glucosidic linkages, and its endogenous inhibitor (LDI) was solved at 2.7 Å. The structure reveals an entirely new and unexpected binding mode of LDI as compared with previously solved complex structures of related cereal type family inhibitors (CTIs) bound to glycoside hydrolases but is structurally analogous to binding of dual specificity CTIs to proteases. Site-directed mutagenesis establishes that a hydrophobic cluster flanked by ionic interactions in the protein-protein interface is vital for the picomolar affinity of LDI to LD as assessed by analysis of binding by using surface plasmon resonance and also supported by LDI inhibition of the enzyme activity. A phylogenetic analysis identified four LDI-like proteins in cereals among the 45 sequences from monocot databases that could be classified as unique CTI sequences. The unprecedented binding mechanism shown here for LDI has likely evolved in cereals from a need for effective inhibition of debranching enzymes having characteristic open active site architecture. The findings give a mechanistic rationale for the potency of LD activity regulation and provide a molecular understanding of the debranching events associated with optimal starch mobilization and utilization during germination. This study unveils a hitherto not recognized structural basis for the features endowing diversity to CTIs.

Keywords: Barley Limit Dextrinase; Cereal Type Inhibitors; Crystal Structure; Debranching Enzyme; Enzyme Inhibitor; Plant Molecular Biology; Protein Complex; Protein-Protein Interaction; Seed Germination; Starch Metabolism Regulation.


Figures

FIGURE 1.
FIGURE 1.
Crystal structure of the complex between LD and LDI. A, overall structure of the LD-LDI complex. LDI is shown in orange. The four LD domains, the CBM21-like N-domain (residues 2–124), the carbohydrate-binding module 48 (CBM48; residues 125–230), the catalytic domain (residues 231–774), and the C-domain (residues 775–884), are depicted in red, green, gray, and blue, respectively. The LD catalytic residues, Asp473, Glu510, and Asp642 are shown as black sticks. Calcium ions are presented as purple spheres. The start and end points of the two unresolved short loops of the N-domain are indicated by asterisks. B, close-up on the LDI structure (orange) and the interaction surface with LD (electrostatic potential: blue and red represent positive and negative potential, respectively). LDI structural elements and cysteines are labeled. C–E, amino acid residues in LDI subjected to mutational analysis (orange sticks and ribbon) and their interaction partners in LD (white sticks and ribbon). C, LDI Arg34 from loop 1 interacts with LD Glu729 and Asp730. D, LDI Arg38 interacts directly with the LD catalytic nucleophile Asp473 and general acid/base Glu510. E, two hydrophobic residues, Leu41 and Val42 in LDI are in contact with LD Trp512, Phe514, and Phe553. F, the electrostatic potential of the solvent-accessible surface of LDI in the area where LD Asp730 interacts with Arg34 and Arg84 from LDI.
FIGURE 2.
FIGURE 2.
Structural alignment of the structure-determined cereal type inhibitors and the LDI (orange). A and B, bifunctional α-amylase/trypsin inhibitor from ragi (A, RBI; blue; PDB code 1B1U) and RBI from the complex with α-amylase from yellow mealworm (B, purple; PDB code 1TMQ). The structural differences at the N terminus are marked with a dashed oval. C and D, CHFI (C, green; PDB code 1BEA) and 0.19 α-amylase inhibitor from wheat (D, red; PDB code 1HSS). The loop involved in protease inhibition by RBI and the CHFI is marked with an oval. See Table 3 for details of the structural similarities between LDI and the structure-determined CTIs.
FIGURE 3.
FIGURE 3.
Structural alignment of the active site residues from barley LD in complex with LDI and from free LD (PDB code 4AIO). Residues of complexed LD (white sticks), which are in contact with LDI (distance <4.0 Å), are superimposed with the corresponding residues of free LD (green sticks). The residues, which adopt different rotamers, are marked with dotted ovals.
FIGURE 4.
FIGURE 4.
Representative plots of single SPR data sets used for obtaining the data shown in Table 5. A, 1:1 binding model (black lines) fitted to the SPR data (orange dashed line) from LD binding to different LDI variants including wild type. B, top panel, sensorgram from the SPR analysis of LD binding to the LDI-V42D variant with the points used for the steady state fit indicated by ×. Bottom panel, steady state plot of data from a triple determination. C, top panel, sensorgram from SPR analysis of LD binding to the LDI-L41GV42D variant. The points used for the steady state fit are indicated by ×. Bottom panel, steady state plot of data from a double determination. D, 1:1 binding model (black) fitted to SPR data (orange dashed line) from analysis of the binding of the two LD variants to wild type LDI.
FIGURE 5.
FIGURE 5.
Multiple alignment of 45 protein sequences identified from BLAST searches with the sequences of LDI, RBI, 0.19 AI, and CHFI against the monocot sequence database. Sequence features are labeled in the subalignment in Fig. 6. See Table 6 for information about each sequence included.
FIGURE 5.
FIGURE 5.
Multiple alignment of 45 protein sequences identified from BLAST searches with the sequences of LDI, RBI, 0.19 AI, and CHFI against the monocot sequence database. Sequence features are labeled in the subalignment in Fig. 6. See Table 6 for information about each sequence included.
FIGURE 6.
FIGURE 6.
LDI and related CTIs. A, multiple sequence alignment of eight CTIs including the three structure-determined proteins: LDI, wheat pUP88, protein from Brachypodium, RBI, rice LDI, CHFI, and dimeric and monomeric wheat α-amylase inhibitors 0.19 AI and 0.28 AI. The secondary structure of LDI is indicated above the alignment, disulfides are numbered 1–4 (below alignment), and the fifth cysteine pair (lacking in LDI-like proteins) is indicated by a green × under the conserved cysteine and a red box around the nonconserved cysteine, as well as an ×. The LDI residues mutated in this study are marked by asterisks. RBI and CHFI residues involved in α-amylase binding or trypsin inhibition are indicated by black boxes. B, phylogenetic tree based on multiple sequence alignment of 45 protein sequences from monocots related to LDI, RBI, 0.19 AI, and CHFI. The clustering of the CTIs is based on the annotation of characterized CTIs: LDI-like proteins (this study), CMx subunits of heterotetrameric α-amylase/protease inhibitors, and mono- and dimeric α-amylase inhibitors. The characterized proteins are indicated by asterisks. See Fig. 5 for the full multiple sequence alignment and Table 6 for source organisms and accession numbers of sequences included in the phylogenetic tree.
FIGURE 7.
FIGURE 7.
SPR analysis of the pH (A) and temperature (B) dependence of the formation of the LD-LDI complex.
FIGURE 8.
FIGURE 8.
van't Hoff energetics and conformational stability of LD-LDI. A, van't Hoff Plot of the fitting of the nonlinear function to the SPR data in the temperature range 10–35 °C. B, differential scanning calorimetry thermograms of LD (5 μm), LDI (25 μm), and LD-LDI (5 μm:25 μm) unfolding at pH 6.5.
FIGURE 9.
FIGURE 9.
Comparison of LDI and RBI binding to LD and TMA. A, the two CTIs, LDI (orange) and RBI (purple) superimpose with an RMSD of 0.8 Å, but the binding modes of LDI to LD (gray) and RBI to TMA (light blue) are completely different. The N-terminal serine of RBI (purple stick and red circle) interacts with the catalytic site residues of TMA (black sticks), whereas the N terminus of LDI has no contact with LD. The catalytic site residues of LD are shown as black sticks. The trypsin-binding loop (harboring Arg34 and Leu35) of RBI is marked with a green oval. B, binding mode of RBI (purple) to TMA (light blue surface) and the electrostatic potential of the RBI interaction surface. Blue and red represent positive and negative potential, respectively. The N terminus of RBI is marked with a dotted oval. C, binding mode of LDI (orange) to LD (gray surface) and the electrostatic potential of the LDI interaction surface. The Leu41–Val42 hotspot of the interaction is marked with a dotted oval (Val42 is not visible).

Similar articles

Cited by

References

    1. Tester R. F., Karkalas J., Qi X. (2004) Starch: composition, fine structure and architecture. J. Cereal Sci. 39, 151–165
    1. Sulpice R., Pyl E. T., Ishihara H., Trenkamp S., Steinfath M., Witucka-Wall H., Gibon Y., Usadel B., Poree F., Piques M. C., Von Korff M., Steinhauser M. C., Keurentjes J. J., Guenther M., Hoehne M., Selbig J., Fernie A. R., Altmann T., Stitt M. (2009) Starch as a major integrator in the regulation of plant growth. Proc. Natl. Acad. Sci. U.S.A. 106, 10348–10353 - PMC - PubMed
    1. Zeeman S. C., Kossmann J., Smith A. M. (2010) Starch: Its metabolism, evolution, and biotechnological modification in plants. Annu. Rev. Plant Biol. 61, 209–234 - PubMed
    1. Burton R. A., Zhang X. Q., Hrmova M., Fincher G. B. (1999) A single limit dextrinase gene is expressed both in the developing endosperm and in germinated grains of barley. Plant Physiol. 119, 859–871 - PMC - PubMed
    1. Kristensen M., Lok F., Planchot V., Svendsen I., Leah R., Svensson B. (1999) Isolation and characterization of the gene encoding the starch debranching enzyme limit dextrinase from germinating barley. Biochim. Biophys. Acta 1431, 538–546 - PubMed

Publication types

MeSH terms