. 2015 Mar 20;10(3):e0120254.
doi: 10.1371/journal.pone.0120254. eCollection 2015.

Dimethyl fumarate and monoethyl fumarate exhibit differential effects on KEAP1, NRF2 activation, and glutathione depletion in vitro

Affiliations

Dimethyl fumarate and monoethyl fumarate exhibit differential effects on KEAP1, NRF2 activation, and glutathione depletion in vitro

Melanie S Brennan et al. PLoS One. .

Abstract

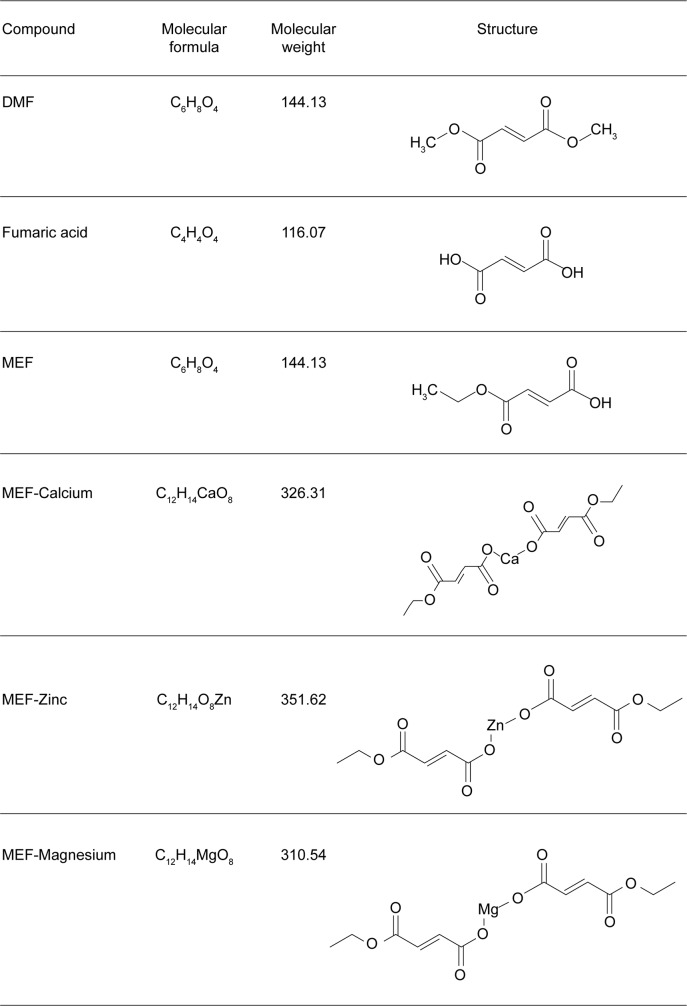
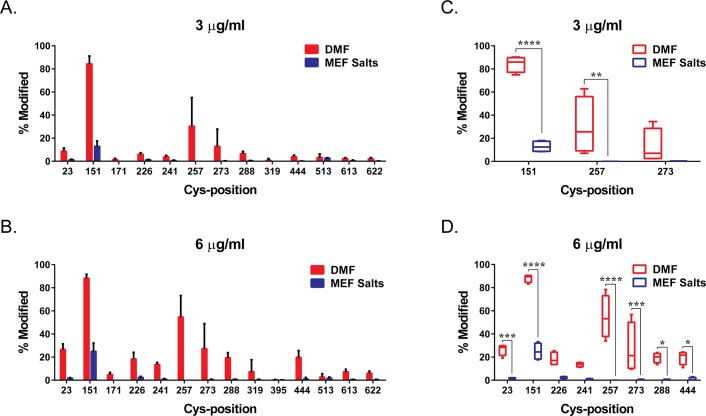
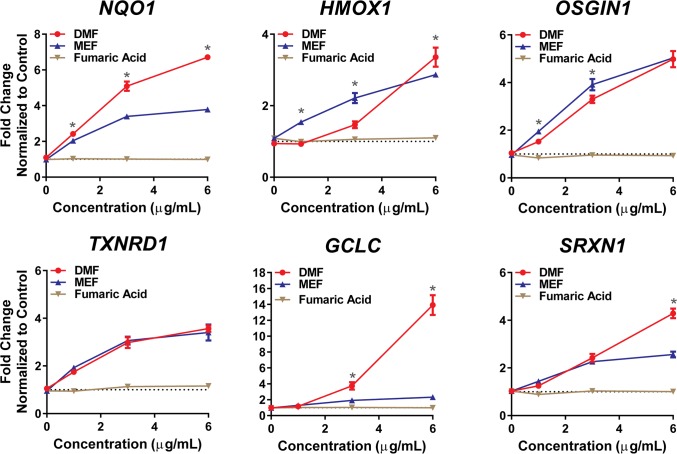
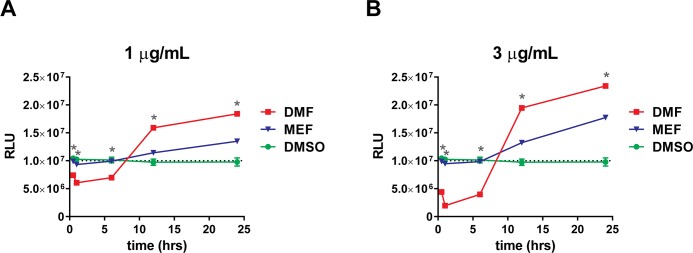
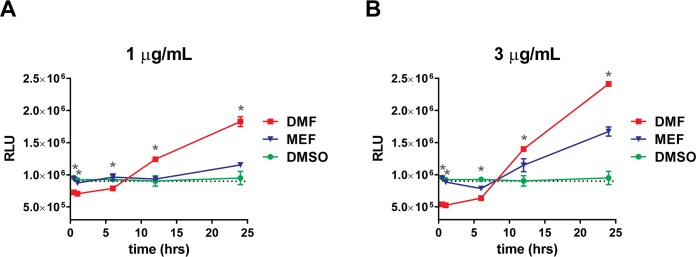
Delayed-release dimethyl fumarate (also known as gastro-resistant dimethyl fumarate), an oral therapeutic containing dimethyl fumarate (DMF) as the active ingredient, is currently approved for the treatment of relapsing multiple sclerosis. DMF is also a component in a distinct mixture product with 3 different salts of monoethyl fumarate (MEF), which is marketed for the treatment of psoriasis. Previous studies have provided insight into the pharmacologic properties of DMF, including modulation of kelch-like ECH-associated protein 1 (KEAP1), activation of the nuclear factor (erythroid-derived 2)-like 2 (NRF2) pathway, and glutathione (GSH) modulation; however, those of MEF remain largely unexplored. Therefore, the aim of this study was to evaluate the in vitro effects of DMF and MEF on KEAP1 modification, activation of the NRF2 pathway, and GSH conjugation. Using mass spectrometry, DMF treatment resulted in a robust modification of specific cysteine residues on KEAP1. In comparison, the overall degree of KEAP1 modification following MEF treatment was significantly less or undetectable. Consistent with KEAP1 cysteine modification, DMF treatment resulted in nuclear translocation of NRF2 and a robust transcriptional response in treated cells, as did MEF; however, the responses to MEF were of a lower magnitude or distinct compared to DMF. DMF was also shown to produce an acute concentration-dependent depletion of GSH; however, GSH levels eventually recovered and rose above baseline by 24 hours. In contrast, MEF did not cause acute reductions in GSH, but did produce an increase by 24 hours. Overall, these studies demonstrate that DMF and MEF are both pharmacologically active, but have differing degrees of activity as well as unique actions. These differences would be expected to result in divergent effects on downstream biology.


Conflict of interest statement

Competing Interests: All authors are employees of Biogen Idec. Financial support for this study was provided by Biogen Idec, Inc., which does not alter the authors' adherence to PLOS ONE policies on sharing data and materials.

Figures

Fig 1
Fig 1. Structure and basic properties of DMF, MEF salts and Fumaric Acid.
DMF and MEF are esters of fumaric acid, which is not pharmacologically active. The active moiety(ies) of DMF and MEF confer their chemical and physical properties.
Fig 2
Fig 2. DMF and MEF Differentially Modify KEAP1 Cysteine Residues.
KEAP1 transfected HEK 293FT cells were treated with DMF and MEF salts (Ca2+, Mg2+, Zn2+) at 3 μg/mL (A, C) or 6 μg/mL (B, D). Resulting cysteine modifications on KEAP1 were analyzed using mass spectrometry. Percent modification of KEAP1 cysteine residues with DMF or MEF was determined relative to DMSO control treated cells. (A, B) Representation of percent cysteine modification of analyzed KEAP1 cysteine residues in the presence of 3 (A) or 6 (B) μg/mL DMF or MEF. Each bar represents the means of quadruplicate determinations (± SD). (C, D) Box-whisker plots demonstrate the means, quartiles, and max-min of KEAP1 cysteine residues modified by greater than 10 percent in A and B. *, p<0.05. ***, p<0.001. ****, p<0.0001. P values are based on two-way analysis of variance (ANOVA) with Sidak’s post-test for multiple comparisons.
Fig 3
Fig 3. NRF2 Translocation Induced by DMF and MEF Treatment.
Human astrocytes were treated with a mixture of MEF salts (Ca2+, Mg2+, Zn2+), DMF or the vehicle control DMSO. Extracts from harvested cells were separated into nuclear and cytoplasmic fractions and equal protein amounts from triplicate aliquots of each fraction were analyzed using an NRF2 TransAM DNA binding assay (A), and Western blots for NRF2, HDAC1 or β-actin (B). Red asterisks (*, p<0.01) indicate comparison of DMF versus MEF at indicated concentration. Black asterisks directly above bar plots (*, p<0.05, ***, p<0.001, ****, p<0.0001) refer to DMF and MEF versus DMSO control at indicated concentrations. P values are based on two-way ANOVA with Tukey’s post-test for multiple comparisons.
Fig 4
Fig 4. DMF and MEF Produce Distinct Changes in Gene Expression in Astrocytes.
Human astrocytes were treated with a concentration-response of DMF, MEF salts (Ca2+, Mg2+, Zn2+) or fumaric acid for 24 hours, and analyzed for transcriptional changes in putative NRF2 target genes (NQO1, HMOX1, OSGIN1, TXNRD1, GCLC and SRXN1). Triplicate determinations (± SD) were normalized as a fold change relative to DMSO controls for each gene and probe set. *, p<0.01 for DMF versus MEF at indicated concentration. P values are based on two-way ANOVA with Tukey’s post-test for multiple comparisons.
Fig 5
Fig 5. DMF and MEF Induce Different Effects on Cellular GSH.
Primary cultures of human astrocytes were incubated with 1 (A) or 3 (B) μg/mL DMF, MEF, or DMSO as a control. Treated cells were harvested after 0.0, 0.5, 1.0, 6, 12, and 24 hours of treatment, and total cellular GSH was measured as relative luminescence units (RLU). Each point represents the mean of triplicate determinations (± SD). Dotted line represents average basal RLU levels. *, p<0.01 for DMF versus MEF at indicated time point. P values are based on two-way ANOVA with Tukey’s post-test for multiple comparisons.
Fig 6
Fig 6. DMF and MEF Induce Different Effects on Extracellular GSH.
Primary cultures of human astrocytes were incubated with 1 (A) or 3 (B) μg/mL DMF, MEF or DMSO as a control. Media was collected from treated cells after 0.0, 0.5, 1.0, 6, 12 or 24 hours of treatment, and total extracellular glutathione was measured as relative luminescence units (RLU). Each point represents the mean of triplicate determinations (± SD). Dotted line represents average basal RLU levels. *, p<0.01 for DMF versus MEF at indicated time point. P values are based on two-way ANOVA with Tukey’s post-test for multiple comparisons.

References

    1. Noseworthy JH, Lucchinetti C, Rodriguez M, Weinshenker BG. Multiple sclerosis. N Engl J Med. 2000;343: 938–952. - PubMed
    1. Fox RJ, Bethoux F, Goldman MD, Cohen JA. Multiple sclerosis: advances in understanding, diagnosing, and treating the underlying disease. Cleve Clin J Med. 2006;73: 91–102. - PubMed
    1. Freedman MS. Disease-modifying drugs for multiple sclerosis: current and future aspects. Expert Opin Pharmacother. 2006;Suppl 1: S1–9. - PubMed
    1. Gilgun-Sherki Y, Melamed E, Offen D. The role of oxidative stress in the pathogenesis of multiple sclerosis: the need for effective antioxidant therapy. J Neurol. 2004;25: 261–268. - PubMed
    1. van Horssen J, Witte ME, Schreibelt G, de Vries HE. Radical changes in multiple sclerosis pathogenesis. Biochim Biophys Acta. 2011;1812: 141–150. 10.1016/j.bbadis.2010.06.011 - DOI - PubMed

Publication types

MeSH terms