. 2015 Mar 20;10(3):e0121399.
doi: 10.1371/journal.pone.0121399. eCollection 2015.

The interaction affinity between vascular cell adhesion molecule-1 (VCAM-1) and very late antigen-4 (VLA-4) analyzed by quantitative FRET

Affiliations

The interaction affinity between vascular cell adhesion molecule-1 (VCAM-1) and very late antigen-4 (VLA-4) analyzed by quantitative FRET

Sandeep Chakraborty et al. PLoS One. .

Abstract

Very late antigen-4 (VLA-4), a member of integrin superfamily, interacts with its major counter ligand vascular cell adhesion molecule-1 (VCAM-1) and plays an important role in leukocyte adhesion to vascular endothelium and immunological synapse formation. However, irregular expressions of these proteins may also lead to several autoimmune diseases and metastasis cancer. Thus, quantifying the interaction affinity of the VCAM-1/VLA-4 interaction is of fundamental importance in further understanding the nature of this interaction and drug discovery. In this study, we report an 'in solution' steady state organic fluorophore based quantitative fluorescence resonance energy transfer (FRET) assay to quantify this interaction in terms of the dissociation constant (Kd). We have used, in our FRET assay, the Alexa Fluor 488-VLA-4 conjugate as the donor, and Alexa Fluor 546-VCAM-1 as the acceptor. From the FRET signal analysis, Kd of this interaction was determined to be 41.82 ± 2.36 nM. To further confirm our estimation, we have employed surface plasmon resonance (SPR) technique to obtain Kd = 39.60 ± 1.78 nM, which is in good agreement with the result obtained by FRET. This is the first reported work which applies organic fluorophore based 'in solution' simple quantitative FRET assay to obtain the dissociation constant of the VCAM-1/VLA-4 interaction, and is also the first quantification of this interaction. Moreover, the value of Kd can serve as an indicator of abnormal protein-protein interactions; hence, this assay can potentially be further developed into a drug screening platform of VLA-4/VCAM-1 as well as other protein-ligand interactions.


Conflict of interest statement

Competing Interests: The authors have declared that no competing interests exist.

Figures

Fig 1
Fig 1. The FRET assay.
(a) A schematic illustration of FRET with AF488-VLA-4 as the donor, and AF546-VCAM-1 as the acceptor conjugates. Upon excitation at 470 nm, two emission peaks, one at 520 nm, and the other at 570 nm were observed; the former originates from the free (unbounded) AF488-VLA-4, while the latter is due to FRET from the binding of the two protein conjugates. Proper amount of Mg2+ was added to the FRET mixture to induce conformational change of VLA-4 to enhance the binding affinity of VLA-4 and VCAM-1. (b) Normalized absorbance and emission spectra of AF488 and AF546 in PBS, pH 7.4.
Fig 2
Fig 2. UV-visible absorption spectra of the dye-protein conjugate to obtain the dye-to-protein (F/P) molar ratio.
The F/P ratios of AF488-VLA-4 and AF546-VCAM-1 were determined to be 3.0 ± 0.8 and 0.60 ± 0.02, respectively. These values were used to deduce the concentration of acceptors and donors in the dye-protein conjugate solutions. Each experiment was repeated three times under identical condition and the results are shown as arithmetic mean ± standard deviation.
Fig 3
Fig 3. Confirming the FRET emission.
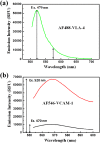
The fluorescence emission spectra of AF488-VLA-4 (100 nM), AF546-VCAM-1 (100 nM), the mixture of AF488-VLA-4 (100 nM) and AF546 (100 nM), and the dyes only mixture of AF488 and AF 546 are compared. The excitation wavelength for the all the cases was 470 nm, the donor excitation maxima. The fluorescence spectrometer gain and integration time (20 μs) was kept constant while obtaining these spectra. For the mixture of A488-VLA-4 + AF546-VCAM-1, an acceptor sensitized emission was observed at 570 nm as compared to the AF488 + AF546 spectrum, which confirmed the FRET activity in our assay.
Fig 4
Fig 4. Determining the FRET signal at the acceptor emission maximum wavelength 570 nm.
(a) Fluorescence emission spectra of the FRET mixtures (AF488-VLA-4 + AF546-VCAM-1). The FRET mixtures were excited at 470 nm. The concentration of AF488-VLA-4 was kept constant at 350 nM while that of AF546-VCAM-1 was varied from 50 nM to 850 nM. The various emission contributions at 570 nm of the FRET emission spectrum were obtained from these spectra at each AF546-VCAM-1 concentration. (b) The fluorescence emission signals of AF488-VLA-4 (Demission) at 520 nm in the FRET mixture upon 470 nm excitation. (c) Fluorescence emission signal of AF546-VCAM-1 (Aemission) in the FRET mixture at 530 nm excitation. (d) The plot of total fluorescence emission of the FRET mixture (DAemission) at 570 nm with 470 nm excitation. Each measurement was repeated three times under identical condition to obtain the mean value and the standard deviation (indicated by the error bar).
Fig 5
Fig 5. Determining the “μ” and “η”.
(a) Fluorescence emission spectrum of AF488-VLA-4 (350 nM) alone when excited at 470 nm. The ratio constant “μ”, defined as the ratio of the emission signal at 570 nm to that at 520 nm of the AF488-VLA-4 emission spectrum was determined to be 0.128 ± 0.031. (b) Fluorescence emission spectra of AF546-VCAM-1 (850 nM) alone when excited at 470 and 520 nm. The ratio constant “η”, defined as the ratio of emission signal at 570 nm upon excitation at 470 nm to that at 570 nm when excited at 520 nm, was determined to be 0.143 ± 0.058. All the experiments were done in triplicate. The results are shown as arithmetic mean ± standard deviation.
Fig 6
Fig 6. Determination of Kd through quantitative FRET and SPR.
(a) Curve fitting of the experimental data representing the absolute FRET emission signals (FRETemission) with Equation (3). Each experiment was repeated three times under identical condition, and the error bar indicates the standard deviation; the results are shown as arithmetic mean ± standard deviation. The maximum FRET emission signal (maxFRETemission) and the corresponding equilibrium dissociation constant (Kd) of the VLA-4/VCAM-1 interaction were determined to be 3184 RFU and 41.82 ± 2.36 nM, respectively. (b) Sensorgrams from the SPR sensor chip in BIAcore indicating the interaction of VCAM-1 (immobilized on the surface of the chip; details can be found in the text) with different concentrations (100, 150, 400, 450, to 500 nM) of VLA-4. The equilibrium dissociation constant (Kd) of the VLA-4/VCAM-1 interaction was determined to be 39.60 ± 1.78 nM.

Similar articles

Cited by

References

    1. Oppenheimer-Marks N, Davis LS, Bogue DT, Ramberg J, Lipsky PE. Differential utilization of ICAM-1 and VCAM-1 during the adhesion and transendothelial migration of human T lymphocytes. J Immunol. 1991; 147: 2913–2921. - PubMed
    1. Weber C, Springer TA. Interaction of very late antigen-4 with VCAM-1 supports transendothelial chemotaxis of monocytes by facilitating lateral migration. J Immunol. 1998; 161: 6825–6834. - PubMed
    1. Ding Z, Xiong K, Issekutz TB. Chemokines stimulate human T lymphocyte transendothelial migration to utilize VLA-4 in addition to LFA-1. J Leukoc Biol. 2001; 69: 458–466. - PubMed
    1. Clark EA, Brugge JS. Integrins and signal transduction pathways: the road taken. Science. 1995; 268: 233–239. - PubMed
    1. Mittelbrunn M, Molina A, Escribese MM, Yáñez-Mó M, Escudero E, Ursa A, et al. VLA-4 integrin concentrates at the peripheral supramolecular activation complex of the immune synapse and drives T helper 1 responses. PNAS. 2004; 101(30): 11058–11063. - PMC - PubMed

Publication types

MeSH terms

Substances