

Proteomic analysis of INS-1 rat insulinoma cells: ER stress effects and the protective role of exenatide, a GLP-1 receptor agonist
- PMID: 25793496
- PMCID: PMC4368701
- DOI: 10.1371/journal.pone.0120536
Proteomic analysis of INS-1 rat insulinoma cells: ER stress effects and the protective role of exenatide, a GLP-1 receptor agonist
Abstract
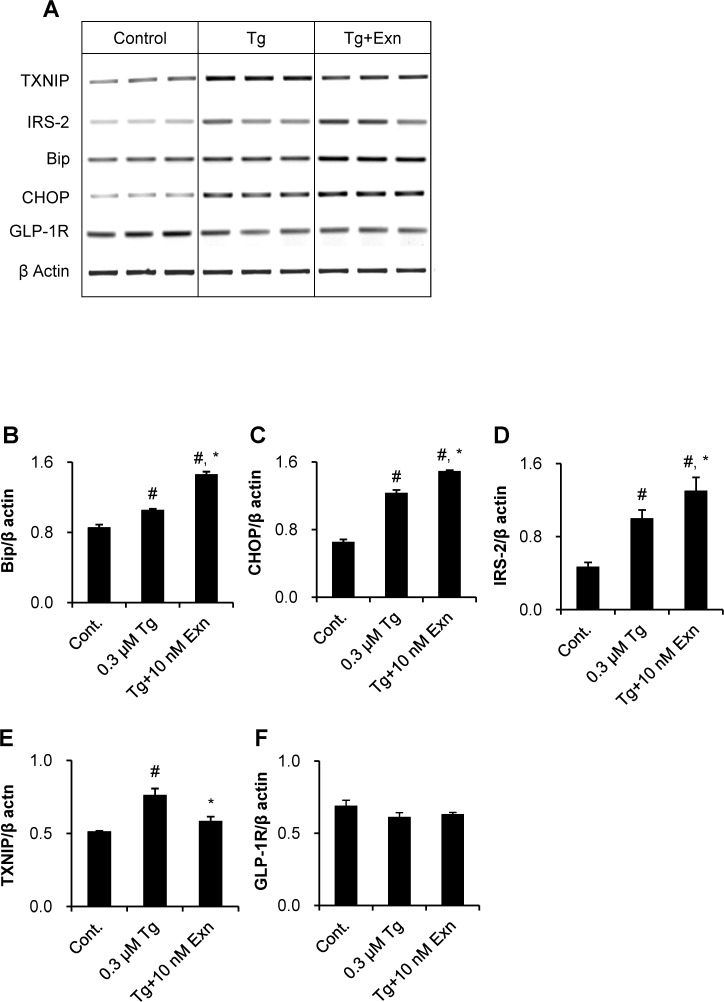
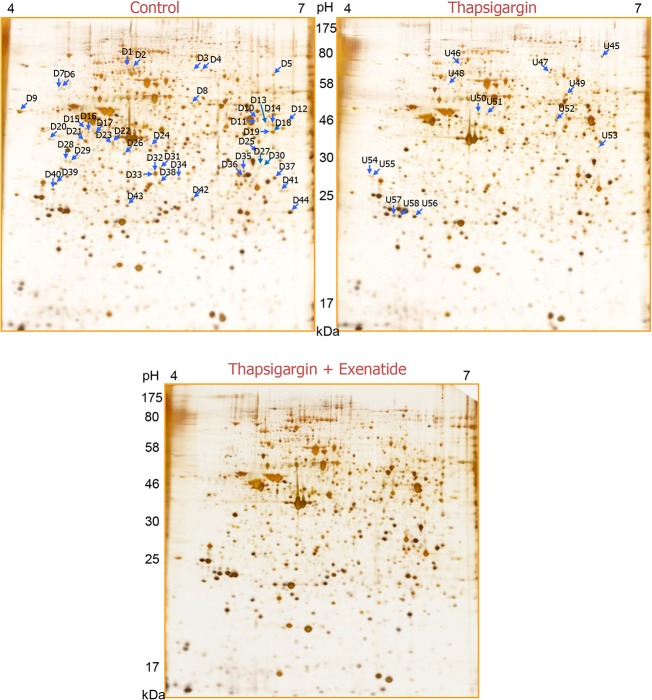
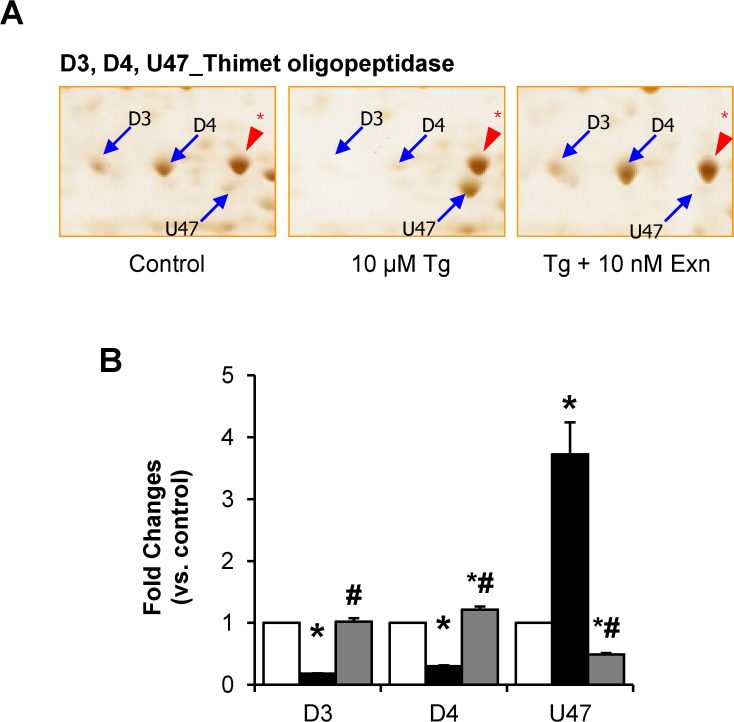
Beta cell death caused by endoplasmic reticulum (ER) stress is a key factor aggravating type 2 diabetes. Exenatide, a glucagon-like peptide (GLP)-1 receptor agonist, prevents beta cell death induced by thapsigargin, a selective inhibitor of ER calcium storage. Here, we report on our proteomic studies designed to elucidate the underlying mechanisms. We conducted comparative proteomic analyses of cellular protein profiles during thapsigargin-induced cell death in the absence and presence of exenatide in INS-1 rat insulinoma cells. Thapsigargin altered cellular proteins involved in metabolic processes and protein folding, whose alterations were variably modified by exenatide treatment. We categorized the proteins with thapsigargin initiated alterations into three groups: those whose alterations were 1) reversed by exenatide, 2) exaggerated by exenatide, and 3) unchanged by exenatide. The most significant effect of thapsigargin on INS-1 cells relevant to their apoptosis was the appearance of newly modified spots of heat shock proteins, thimet oligopeptidase and 14-3-3β, ε, and θ, and the prevention of their appearance by exenatide, suggesting that these proteins play major roles. We also found that various modifications in 14-3-3 isoforms, which precede their appearance and promote INS-1 cell death. This study provides insights into the mechanisms in ER stress-caused INS-1 cell death and its prevention by exenatide.
Conflict of interest statement
Figures


Similar articles
-
Differential protective effects of exenatide, an agonist of GLP-1 receptor and Piragliatin, a glucokinase activator in beta cell response to streptozotocin-induced and endoplasmic reticulum stresses.PLoS One. 2013 Sep 19;8(9):e73340. doi: 10.1371/journal.pone.0073340. eCollection 2013. PLoS One. 2013. PMID: 24069189 Free PMC article.
-
Effect of Liraglutide on endoplasmic reticulum stress in diabetes.Biochem Biophys Res Commun. 2013 Nov 8;441(1):133-8. doi: 10.1016/j.bbrc.2013.10.026. Epub 2013 Oct 12. Biochem Biophys Res Commun. 2013. PMID: 24129189
-
Melatonin-mediated insulin synthesis during endoplasmic reticulum stress involves HuD expression in rat insulinoma INS-1E cells.J Pineal Res. 2013 Sep;55(2):207-20. doi: 10.1111/jpi.12064. Epub 2013 May 28. J Pineal Res. 2013. PMID: 23711134
-
Proteome-wide study of endoplasmic reticulum stress induced by thapsigargin in N2a neuroblastoma cells.Neurochem Int. 2013 Jan;62(1):58-69. doi: 10.1016/j.neuint.2012.11.003. Epub 2012 Nov 12. Neurochem Int. 2013. PMID: 23153458
-
Imaging of Insulinoma by Targeting Glucagonlike Peptide-1 Receptor.PET Clin. 2021 Apr;16(2):205-217. doi: 10.1016/j.cpet.2020.12.008. Epub 2021 Feb 12. PET Clin. 2021. PMID: 33589387 Review.
Cited by
-
Proteomic Analysis of Hippocampus in a Mouse Model of Depression Reveals Neuroprotective Function of Ubiquitin C-terminal Hydrolase L1 (UCH-L1) via Stress-induced Cysteine Oxidative Modifications.Mol Cell Proteomics. 2018 Sep;17(9):1803-1823. doi: 10.1074/mcp.RA118.000835. Epub 2018 Jun 29. Mol Cell Proteomics. 2018. PMID: 29959188 Free PMC article.
-
Pancreatic INS-1 β-Cell Response to Thapsigargin and Rotenone: A Comparative Proteomics Analysis Uncovers Key Pathways of β-Cell Dysfunction.Chem Res Toxicol. 2022 Jun 20;35(6):1080-1094. doi: 10.1021/acs.chemrestox.2c00058. Epub 2022 May 11. Chem Res Toxicol. 2022. PMID: 35544339 Free PMC article.
-
Oral DhHP-6 for the Treatment of Type 2 Diabetes Mellitus.Int J Mol Sci. 2019 Mar 26;20(6):1517. doi: 10.3390/ijms20061517. Int J Mol Sci. 2019. PMID: 30917579 Free PMC article.
-
Exendin-4 protects HUVECs from tunicamycin-induced apoptosis via inhibiting the IRE1a/JNK/caspase-3 pathway.Endocrine. 2017 Mar;55(3):764-772. doi: 10.1007/s12020-016-1190-4. Epub 2016 Dec 3. Endocrine. 2017. PMID: 27915415
-
Degradation of Redox-Sensitive Proteins including Peroxiredoxins and DJ-1 is Promoted by Oxidation-induced Conformational Changes and Ubiquitination.Sci Rep. 2016 Oct 5;6:34432. doi: 10.1038/srep34432. Sci Rep. 2016. PMID: 27703196 Free PMC article.
References
Publication types
MeSH terms
Substances
LinkOut - more resources
Full Text Sources
Other Literature Sources
Medical
