

The cost-effectiveness of monitoring strategies for antiretroviral therapy of HIV infected patients in resource-limited settings: software tool
- PMID: 25793531
- PMCID: PMC4368574
- DOI: 10.1371/journal.pone.0119299
The cost-effectiveness of monitoring strategies for antiretroviral therapy of HIV infected patients in resource-limited settings: software tool
Abstract
Background: The cost-effectiveness of routine viral load (VL) monitoring of HIV-infected patients on antiretroviral therapy (ART) depends on various factors that differ between settings and across time. Low-cost point-of-care (POC) tests for VL are in development and may make routine VL monitoring affordable in resource-limited settings. We developed a software tool to study the cost-effectiveness of switching to second-line ART with different monitoring strategies, and focused on POC-VL monitoring.
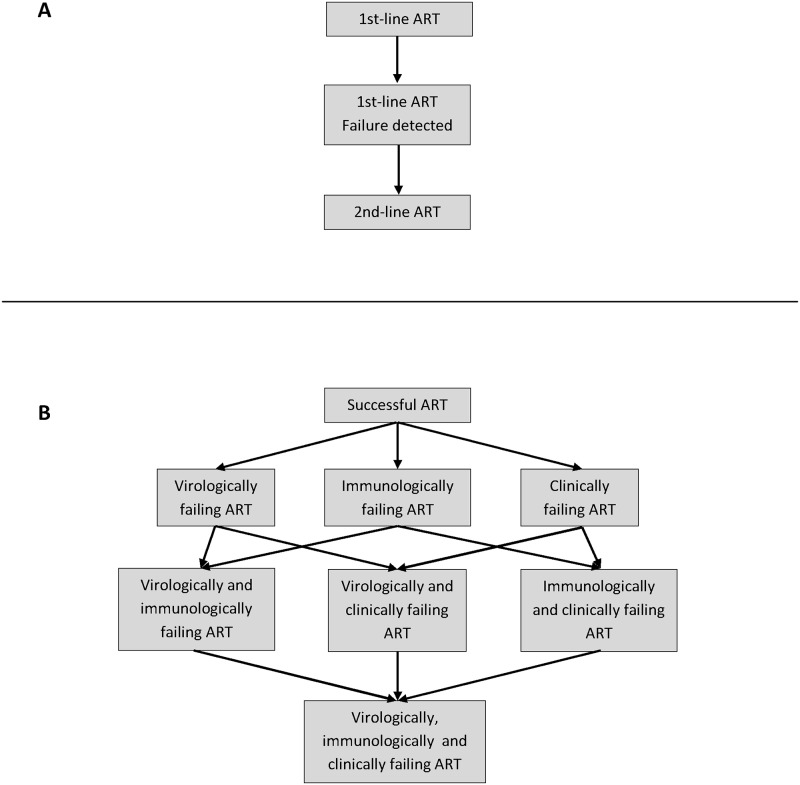
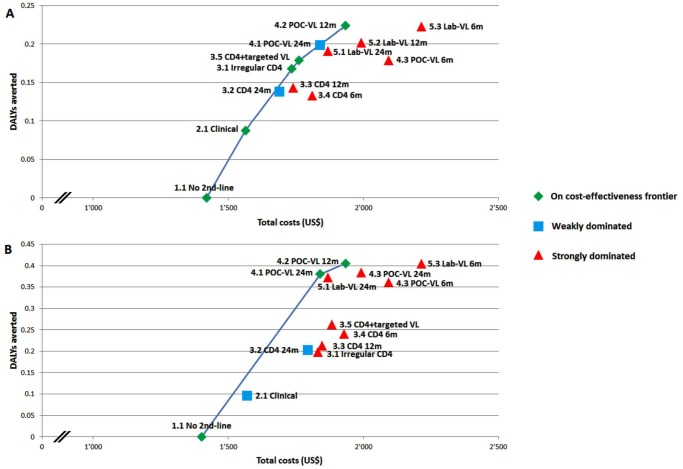
Methods: We used a mathematical model to simulate cohorts of patients from start of ART until death. We modeled 13 strategies (no 2nd-line, clinical, CD4 (with or without targeted VL), POC-VL, and laboratory-based VL monitoring, with different frequencies). We included a scenario with identical failure rates across strategies, and one in which routine VL monitoring reduces the risk of failure. We compared lifetime costs and averted disability-adjusted life-years (DALYs). We calculated incremental cost-effectiveness ratios (ICER). We developed an Excel tool to update the results of the model for varying unit costs and cohort characteristics, and conducted several sensitivity analyses varying the input costs.
Results: Introducing 2nd-line ART had an ICER of US$1651-1766/DALY averted. Compared with clinical monitoring, the ICER of CD4 monitoring was US$1896-US$5488/DALY averted and VL monitoring US$951-US$5813/DALY averted. We found no difference between POC- and laboratory-based VL monitoring, except for the highest measurement frequency (every 6 months), where laboratory-based testing was more effective. Targeted VL monitoring was on the cost-effectiveness frontier only if the difference between 1st- and 2nd-line costs remained large, and if we assumed that routine VL monitoring does not prevent failure.
Conclusion: Compared with the less expensive strategies, the cost-effectiveness of routine VL monitoring essentially depends on the cost of 2nd-line ART. Our Excel tool is useful for determining optimal monitoring strategies for specific settings, with specific sex-and age-distributions and unit costs.
Conflict of interest statement
Figures
References
-
- World Health Organization (2013) Consolidated guidelines on the use of antiretroviral drugs for treating and preventing HIV infection: Recommendations for a public health approach. Geneva, Switzerland: World Health Organization; Available: http://apps.who.int/iris/bitstream/10665/85321/1/9789241505727_eng.pdf?ua=1. Accessed 18 December 2014.
-
- Joint United Nations Programme on HIV/AIDS (UNAIDS) and Médecines Sans Frontières (MSF) (2012) Speed up scale-up: Strategies, tools and policies to get the best HIV treatment to more people, sooner. UNAIDS; MSF. Available: http://www.msfaccess.org/sites/default/files/MSF_assets/HIV_AIDS/Docs/AI.... Accessed 18 December 2014.
Publication types
MeSH terms
Grants and funding
LinkOut - more resources
Full Text Sources
Other Literature Sources
Medical
Research Materials
