. 2015 Mar 20;10(3):e0118504.
doi: 10.1371/journal.pone.0118504. eCollection 2015.

Automatic prediction of cardiovascular and cerebrovascular events using heart rate variability analysis

Affiliations

Automatic prediction of cardiovascular and cerebrovascular events using heart rate variability analysis

Paolo Melillo et al. PLoS One. .

Abstract

Background: There is consensus that Heart Rate Variability is associated with the risk of vascular events. However, Heart Rate Variability predictive value for vascular events is not completely clear. The aim of this study is to develop novel predictive models based on data-mining algorithms to provide an automatic risk stratification tool for hypertensive patients.

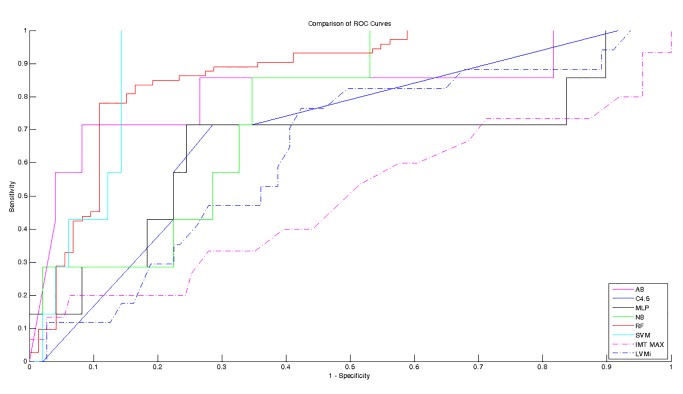
Methods: A database of 139 Holter recordings with clinical data of hypertensive patients followed up for at least 12 months were collected ad hoc. Subjects who experienced a vascular event (i.e., myocardial infarction, stroke, syncopal event) were considered as high-risk subjects. Several data-mining algorithms (such as support vector machine, tree-based classifier, artificial neural network) were used to develop automatic classifiers and their accuracy was tested by assessing the receiver-operator characteristics curve. Moreover, we tested the echographic parameters, which have been showed as powerful predictors of future vascular events.

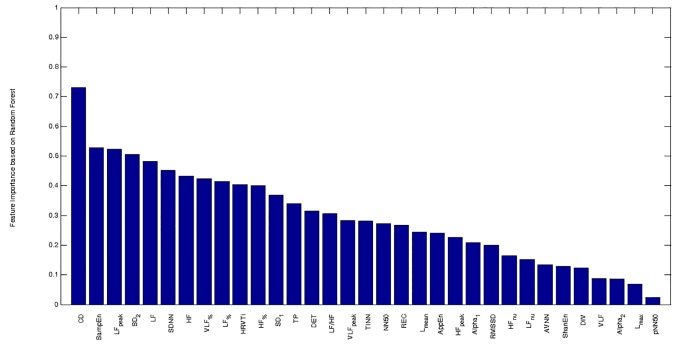
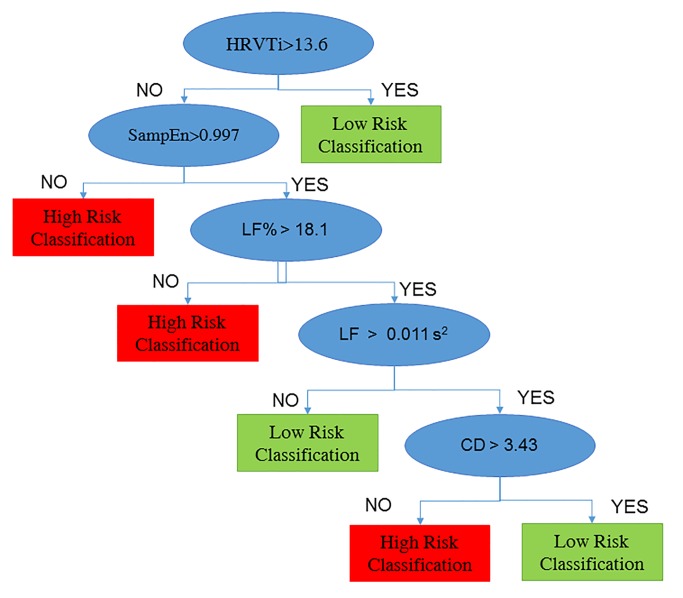
Results: The best predictive model was based on random forest and enabled to identify high-risk hypertensive patients with sensitivity and specificity rates of 71.4% and 87.8%, respectively. The Heart Rate Variability based classifier showed higher predictive values than the conventional echographic parameters, which are considered as significant cardiovascular risk factors.

Conclusions: Combination of Heart Rate Variability measures, analyzed with data-mining algorithm, could be a reliable tool for identifying hypertensive patients at high risk to develop future vascular events.


Conflict of interest statement

Competing Interests: The authors have declared that no competing interests exist.

Figures

Fig 1
Fig 1. Feature importance computed by using Random Forest algorithm.
CD: Correlation dimension. SampEn: Sample entropy. LFpeak: peak frequency of LF band. SD2: long-term variability in Poincaré Plot. LF: absolute power in low frequency band (0.04–0.15 Hz). SDNN: standard deviation of all RR intervals. HF: absolute power in high frequency band (0.15–0.4 Hz). VLF%: relative power in very low frequency band (0–0.04 Hz). LF%: relative power in low frequency band (0.04–0.15 Hz). HRVTi: HRV triangular index. HF%: relative power in high frequency band (0.15–0.4 Hz). SD1: short-term variability in Poincaré Plot. TP: total power. DET: determinism. LF/HF: the ratio between LF and HF. VLFpeak: peak frequency of VLF band. TINN: triangular interpolation of RR interval histogram. NN50: number of differences between adjacent RR intervals that are longer than 50 ms. REC: recurrence rate. Lmean: mean length of lines in recurrence plot. AppEn: Approximate Entropy. HFpeak: peak frequency of HF band. Alpha1: short-term fluctuations in Detrended Fluctuation Analysis. RMSSD: square root of the mean of the sum of the squares of differences between adjacent RR intervals. HFnu: power in high frequency band (0.15–0.4 Hz), expressed in normalized unit. LFnu: power in low frequency band (0.04–0.15 Hz), expressed in normalized unit. AVNN: Average of all RR intervals. ShanEn: Shannon Entropy. DIV: Divergence. VLF: absolute power in very low frequency band (0–0.04 Hz). Alpha2: long-term fluctuations in Detrended Fluctuation Analysis. Lmax: maximal length of lines in recurrence plot. pNN50: percentage of differences between adjacent RR intervals that are longer than 50 ms.
Fig 2
Fig 2. Receiver-operator characteristic curves for predicting vascular events by HRV-based classifiers and echographic parameters.
The HRV-based classifiers are able to predict vascular events with higher sensitivity and specificity rate than echographic parameters. Sensitivity is determined from the proportion of patient developing a vascular event identified as high risk; specificity is determined from the proportion of patient free of vascular events identified as low risk. Solid lines represent classifier based on HRV features, dash-dot lines represent classifications based on echographic parameters. AB: Adaboost. MLP: Multilayer Perceptron. NB: Naïve Bayes classifier. RF: Random Forest. SVM: Support Vector Machine. LVMi.: Left ventricular mass index. IMT MAX: maximum of intima media thickness.
Fig 3
Fig 3. Decision tree for prediction of vascular events.
The decision tree shows the set of rules adopted for classify high and low risk subjects: if HRVTi is higher than 13.6, the subject is classified as low risk, otherwise if SampEn lower than 0.997 or LF% lower than 18.1%, the subject is classified as high risk. The remaining subjects (with higher SampEn and LF%), are classified based on LF and CF: as high risk, if LF is higher than 0.001 s2 and CD is lower 3.43, otherwise as low risk. HRVTi: HRV Triangular Index. SampEn: Sample Entropy. LF: Low Frequency. LF%: Low Frequency expressed as percentage of Total Power. CD: correlation dimension.

Similar articles

Cited by

References

    1. Fuster V. Epidemic of cardiovascular disease and stroke: the three main challenges. Presented at the 71st scientific sessions of the American Heart Association. Dallas, Texas. Circulation. 1999;99(9):1132–7. PubMed PMID: . - PubMed
    1. Murray CJ, Lopez AD. Mortality by cause for eight regions of the world: Global Burden of Disease Study. Lancet. 1997;349(9061):1269–76. 10.1016/S0140-6736(96)07493-4 PubMed PMID: . - DOI - PubMed
    1. Rothwell PM, Coull AJ, Silver LE, Fairhead JF, Giles MF, Lovelock CE, et al. Population-based study of event-rate, incidence, case fatality, and mortality for all acute vascular events in all arterial territories (Oxford Vascular Study). Lancet. 2005;366(9499):1773–83. 10.1016/S0140-6736(05)67702-1 PubMed PMID: . - DOI - PubMed
    1. Lorenz MW, Markus HS, Bots ML, Rosvall M, Sitzer M. Prediction of clinical cardiovascular events with carotid intima-media thickness: a systematic review and meta-analysis. Circulation. 2007;115(4):459–67. 10.1161/CIRCULATIONAHA.106.628875 PubMed PMID: . - DOI - PubMed
    1. Nagai K, Shibata S, Akishita M, Sudoh N, Obara T, Toba K, et al. Efficacy of combined use of three non-invasive atherosclerosis tests to predict vascular events in the elderly; carotid intima-media thickness, flow-mediated dilation of brachial artery and pulse wave velocity. Atherosclerosis. 2013;231(2):365–70. 10.1016/j.atherosclerosis.2013.09.028 - DOI - PubMed

Publication types