. 2015 Mar 20;10(3):e0119045.
doi: 10.1371/journal.pone.0119045. eCollection 2015.

Microstructural changes across different clinical milestones of disease in amyotrophic lateral sclerosis

Affiliations

Microstructural changes across different clinical milestones of disease in amyotrophic lateral sclerosis

Francesca Trojsi et al. PLoS One. .

Abstract

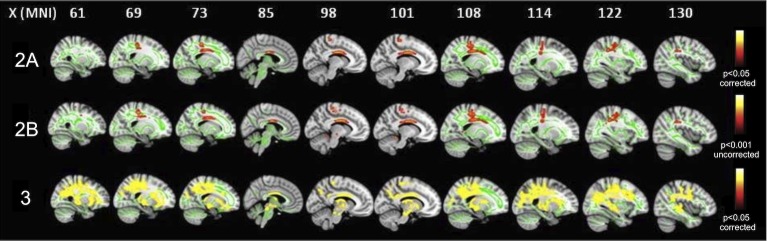
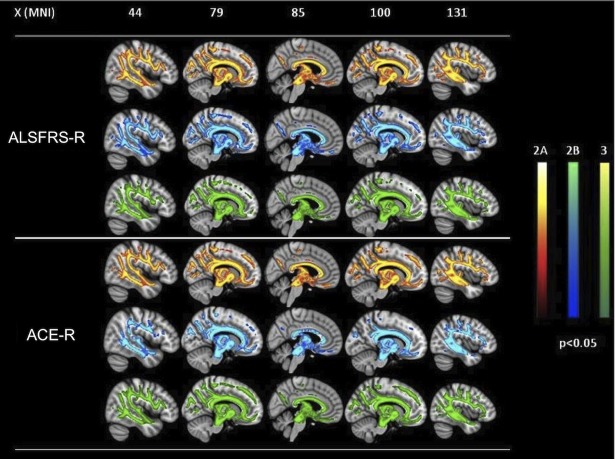
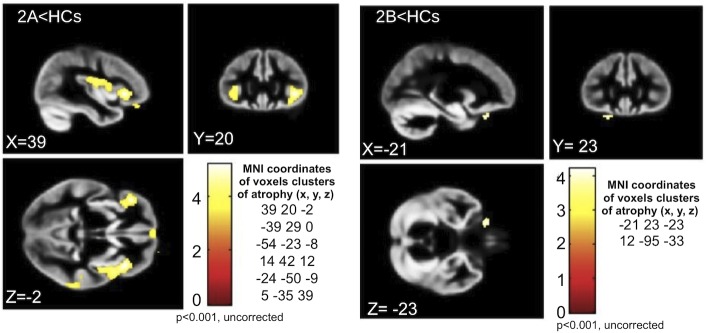
Neurodegenerative process in amyotrophic lateral sclerosis (ALS) has been proven to involve several cortical and subcortical brain regions within and beyond motor areas. However, how ALS pathology spreads progressively during disease evolution is still unknown. In this cross-sectional study we investigated 54 ALS patients, divided into 3 subsets according to the clinical stage, and 18 age and sex-matched healthy controls, by using tract-based spatial statistics (TBSS) diffusion tensor imaging (DTI) and voxel-based morphometry (VBM) analyses. We aimed to identify white (WM) and gray matter (GM) patterns of disease distinctive of each clinical stage, corresponding to specific clinical milestones. ALS cases in stage 2A (i.e., at diagnosis) were characterized by GM and WM impairment of left motor and premotor cortices and brainstem at ponto-mesenchephalic junction. ALS patients in clinical stage 2B (with impairment of two functional regions) exhibited decreased fractional anisotropy (FA) (p<0.001, uncorrected) and increased mean (MD) and radial diffusivity (RD) (p<0.001, uncorrected) in the left cerebellar hemisphere and brainstem precerebellar nuclei, as well as in motor areas, while GM atrophy (p<0.001, uncorrected) was detected only in the left inferior frontal gyrus and right cuneus. Finally, ALS patients in stage 3 (with impairment of three functional regions) exhibited decreased FA and increased MD and RD (p<0.05, corrected) within WM underneath bilateral pre and postcentral gyri, corpus callosum midbody, long associative tracts and midbrain, while no significant clusters of GM atrophy were observed. Our findings reinforce the hypothesis that the neurodegenerative process propagates along the axonal pathways and develops beyond motor areas from early stages, involving progressively several frontotemporal regions and their afferents and efferents, while the detection of GM atrophy in earlier stages and its disappearance in later stages may be the result of reactive gliosis.


Conflict of interest statement

Competing Interests: The authors have declared that no competing interests exist.

Figures

Fig 1
Fig 1. FA differences between ALS patients in the three stages of ALS and healthy controls.
in the stage 2A, FA decrease (red-yellow scale, p<0.05, corrected) is evident in the body of CC and left corticospinal tract (CST), principally in its rostral part underneath primary motor cortex (upper panels); in the stage 2B, FA decrease (red-yellow scale, p<0.001, uncorrected) occurs in the left cerebellar hemisphere, beyond CC body and WM underneath the left precentral gyrus (middle panels); in the stage 3, FA decrease (red-yellow scale) (p<0.05, corrected) is highlighted in WM underneath pre and postcentral gyri including the rostral part of CSTs, the body of CC, bilateral superior and inferior longitudinal and inferior fronto-occipital fasciculi (lower panels).
Fig 2
Fig 2. Voxel-wise correlation analyses between ALSFRS-R and ACE-R scores and FA in the three groups of patients.
Widespread patterns of positive correlations (p<0.05, corrected) between both disability scores and FA in all clinical stages examined, with overlaps between the three patients groups.
Fig 3
Fig 3. VBM results in 2A and 2B subsets compared to healthy controls.
ALS patients in stage 2A show GM atrophy (p<0.001, uncorrected) in the right and left precentral gyri, left inferior frontal gyrus, right anterior cingulate, right medial frontal gyrus, left superior temporal gyrus, left parahippocampal gyrus and right insula (left panels). ALS patients in stage 2B exhibit GM atrophy (p<0.001, uncorrected) only in the left inferior frontal gyrus and right cuneus (right panels).

References

    1. Kiernan MC, Vucic S, Cheah BC, Turner MR, Eisen A, Hardiman O, et al. Amyotrophic lateral sclerosis. Lancet 2011; 377: 942–955. 10.1016/S0140-6736(10)61156-7 - DOI - PubMed
    1. Geser F, Brandmeir NJ, Kwong LK, Martinez-Lage M, Elman L, McCluskey L, et al. Evidence of multisystem disorder in whole-brain map of pathological TDP-43 in amyotrophic lateral sclerosis. Arch Neurol. 2008; 65: 636–641. 10.1001/archneur.65.5.636 - DOI - PubMed
    1. Geser F, Martinez-Lage M, Robinson J, Uryu K, Neumann M, Brandmeir NJ, et al. Clinical and pathological continuum of multisystem TDP-43 proteinopathies. Arch Neurol. 2009; 66: 180–189. 10.1001/archneurol.2008.558 - DOI - PMC - PubMed
    1. Kassubek J, Ludolph AC, Müller HP. Neuroimaging of motor neuron diseases. Ther Adv Neurol Disord. 2012; 5: 119–127. 10.1177/1756285612437562 - DOI - PMC - PubMed
    1. Agosta F, Pagani E, Rocca MA, Caputo D, Perini M, Salvi F, et al. Voxel based morphometry study of brain volumetry and diffusivity in amyotrophic lateral sclerosis patients with mild disability. Hum Brain Mapp. 2007; 28: 1430–1438. - PMC - PubMed