A model of lipid-free apolipoprotein A-I revealed by iterative molecular dynamics simulation
- PMID: 25793886
- PMCID: PMC4368682
- DOI: 10.1371/journal.pone.0120233
A model of lipid-free apolipoprotein A-I revealed by iterative molecular dynamics simulation
Abstract
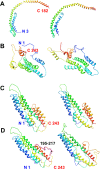
Apolipoprotein A-I (apo A-I), the major protein component of high-density lipoprotein, has been proven inversely correlated to cardiovascular risk in past decades. The lipid-free state of apo A-I is the initial stage which binds to lipids forming high-density lipoprotein. Molecular models of lipid-free apo A-I have been reported by methods like X-ray crystallography and chemical cross-linking/mass spectrometry (CCL/MS). Through structural analysis we found that those current models had limited consistency with other experimental results, such as those from hydrogen exchange with mass spectrometry. Through molecular dynamics simulations, we also found those models could not reach a stable equilibrium state. Therefore, by integrating various experimental results, we proposed a new structural model for lipid-free apo A-I, which contains a bundled four-helix N-terminal domain (1-192) that forms a variable hydrophobic groove and a mobile short hairpin C-terminal domain (193-243). This model exhibits an equilibrium state through molecular dynamics simulation and is consistent with most of the experimental results known from CCL/MS on lysine pairs, fluorescence resonance energy transfer and hydrogen exchange. This solution-state lipid-free apo A-I model may elucidate the possible conformational transitions of apo A-I binding with lipids in high-density lipoprotein formation.
Conflict of interest statement
Figures


Similar articles
-
The lipid-free structure of apolipoprotein A-I: effects of amino-terminal deletions.Biochemistry. 1998 Aug 25;37(34):11714-25. doi: 10.1021/bi973112k. Biochemistry. 1998. PMID: 9718294
-
A three-dimensional molecular model of lipid-free apolipoprotein A-I determined by cross-linking/mass spectrometry and sequence threading.Biochemistry. 2005 Mar 1;44(8):2759-69. doi: 10.1021/bi047717+. Biochemistry. 2005. PMID: 15723520
-
The use of chemical cross-linking and mass spectrometry to elucidate the tertiary conformation of lipid-bound apolipoprotein A-I.Curr Opin Lipidol. 2006 Jun;17(3):214-20. doi: 10.1097/01.mol.0000226111.05060.f4. Curr Opin Lipidol. 2006. PMID: 16680024 Review.
-
Contributions of the N- and C-terminal helical segments to the lipid-free structure and lipid interaction of apolipoprotein A-I.Biochemistry. 2006 Aug 29;45(34):10351-8. doi: 10.1021/bi060726t. Biochemistry. 2006. PMID: 16922511
-
Structural models of human apolipoprotein A-I: a critical analysis and review.Biochim Biophys Acta. 2001 Mar 30;1531(1-2):4-46. doi: 10.1016/s1388-1981(01)00081-6. Biochim Biophys Acta. 2001. PMID: 11278170 Review.
Cited by
-
Structure-function analysis of naturally occurring apolipoprotein A-I L144R, A164S and L178P mutants provides insight on their role on HDL levels and cardiovascular risk.Cell Mol Life Sci. 2021 Feb;78(4):1523-1544. doi: 10.1007/s00018-020-03583-y. Epub 2020 Jul 14. Cell Mol Life Sci. 2021. PMID: 32666307 Free PMC article.
-
Multiscale Simulations of Biological Membranes: The Challenge To Understand Biological Phenomena in a Living Substance.Chem Rev. 2019 May 8;119(9):5607-5774. doi: 10.1021/acs.chemrev.8b00538. Epub 2019 Mar 12. Chem Rev. 2019. PMID: 30859819 Free PMC article.
-
Lipidated apolipoprotein E4 structure and its receptor binding mechanism determined by a combined cross-linking coupled to mass spectrometry and molecular dynamics approach.PLoS Comput Biol. 2018 Jun 22;14(6):e1006165. doi: 10.1371/journal.pcbi.1006165. eCollection 2018 Jun. PLoS Comput Biol. 2018. PMID: 29933361 Free PMC article.
-
A consensus model of human apolipoprotein A-I in its monomeric and lipid-free state.Nat Struct Mol Biol. 2017 Dec;24(12):1093-1099. doi: 10.1038/nsmb.3501. Epub 2017 Nov 13. Nat Struct Mol Biol. 2017. PMID: 29131142 Free PMC article.
References
-
- Barter P, Gotto AM, LaRosa JC, Maroni J, Szarek M, Grundy SM, et al. HDL cholesterol, very low levels of LDL cholesterol, and cardiovascular events. New England Journal of Medicine. 2007;357(13):1301–10. . - PubMed
-
- Segrest JP, Jones MK, Deloof H, Brouillette CG, Venkatachalapathi YV, Anantharamaiah GM. The Amphipathic Helix in the Exchangeable Apolipoproteins—a Review of Secondary Structure and Function. Journal of Lipid Research. 1992;33(2):141–66. . - PubMed
-
- Segrest JP, Li L, Anantharamaiah GM, Harvey SC, Liadaki KN, Zannis V. Structure and function of apolipoprotein A-I and high-density lipoprotein. Current Opinion in Lipidology. 2000;11(2):105–15. . - PubMed
-
- Rye KA, Barter PJ. Formation and metabolism of prebeta-migrating, lipid-poor apolipoprotein A-I. Arteriosclerosis Thrombosis and Vascular Biology. 2004;24(3):421–8. . - PubMed
Publication types
MeSH terms
Substances
LinkOut - more resources
Full Text Sources
Other Literature Sources
Miscellaneous

