. 2015 Mar 19;57(6):1034-1046.
doi: 10.1016/j.molcel.2015.02.015.

The p53 C terminus controls site-specific DNA binding and promotes structural changes within the central DNA binding domain

Affiliations

The p53 C terminus controls site-specific DNA binding and promotes structural changes within the central DNA binding domain

Oleg Laptenko et al. Mol Cell. .

Abstract

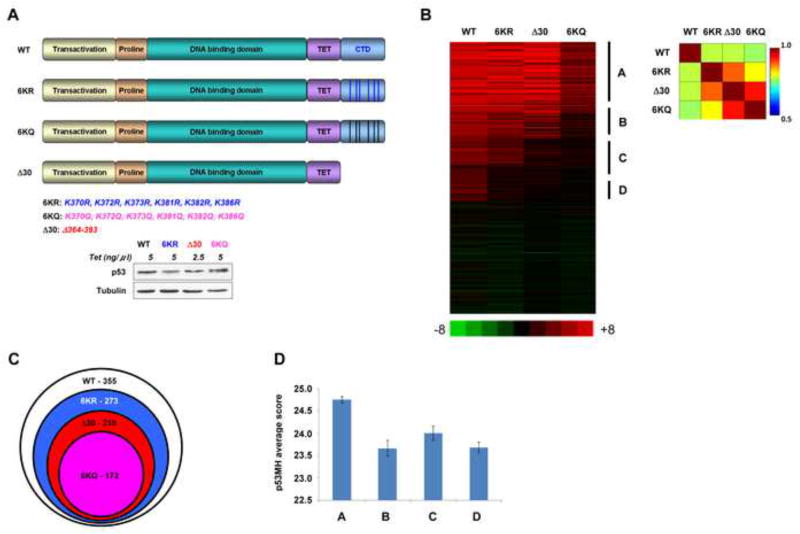
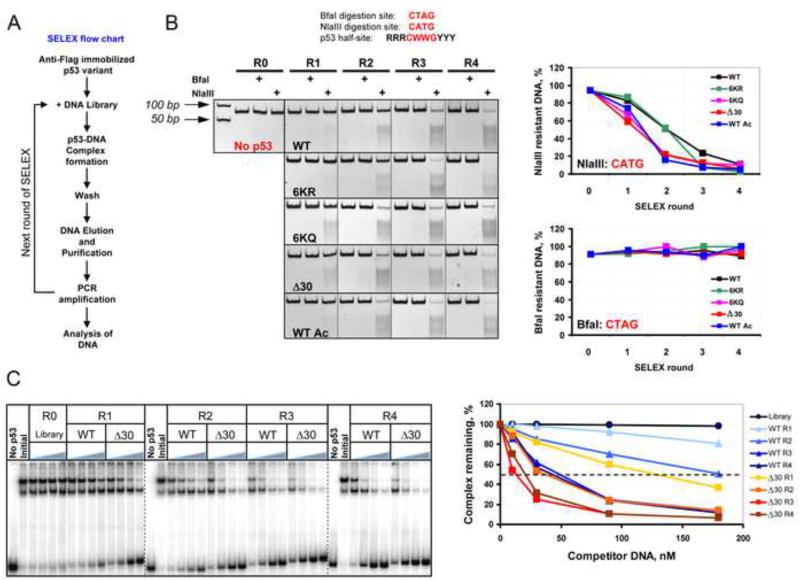
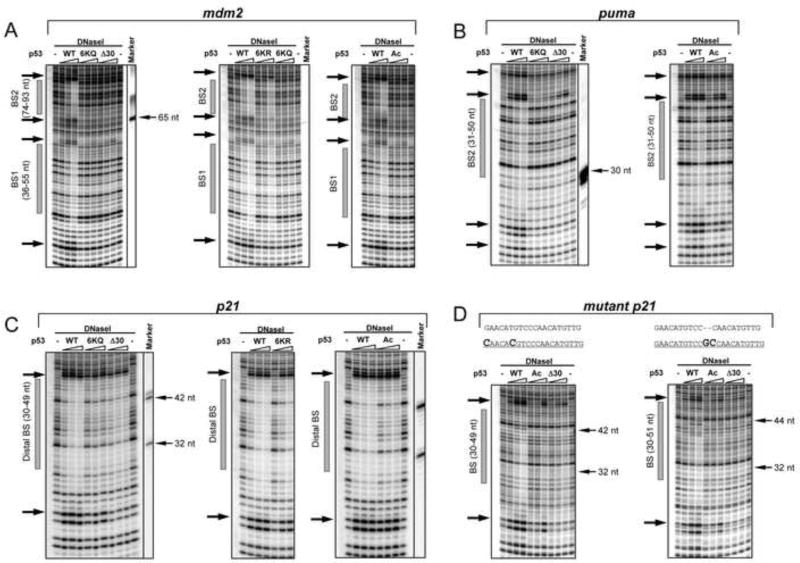
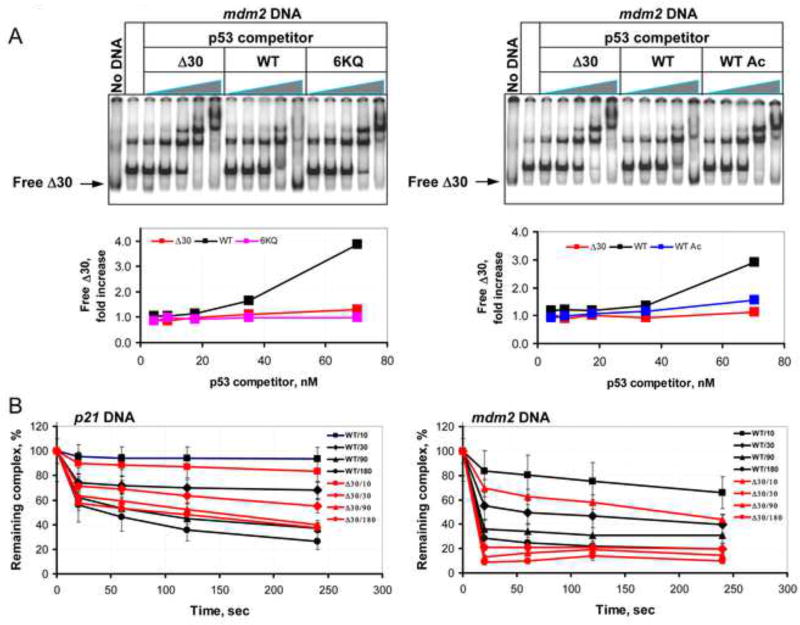
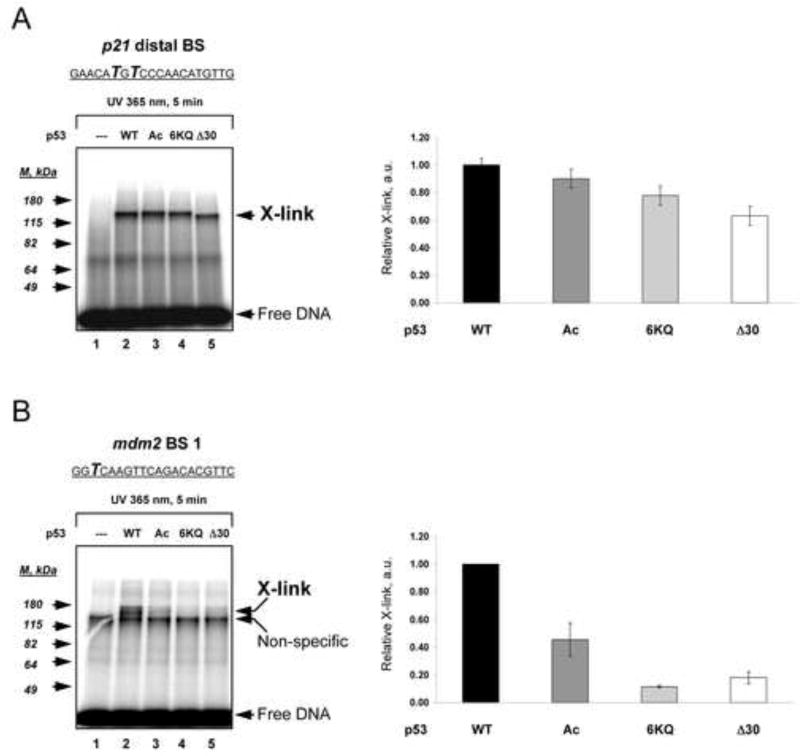
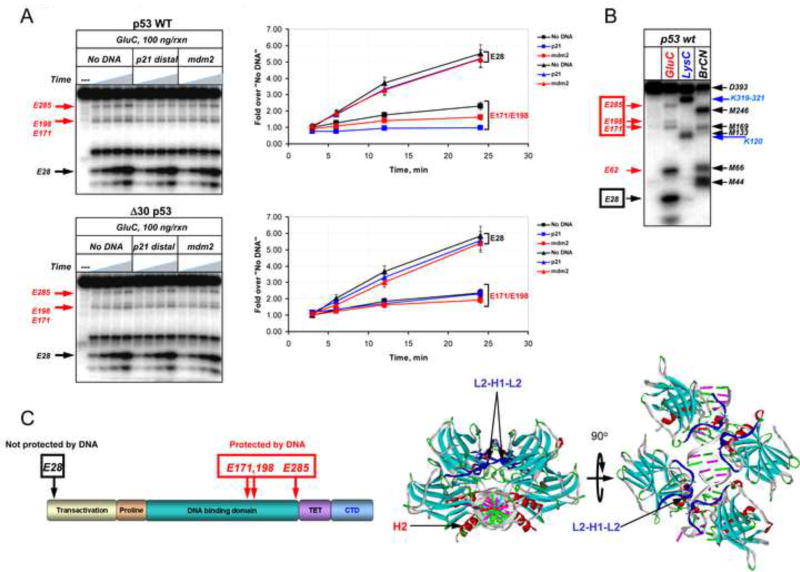
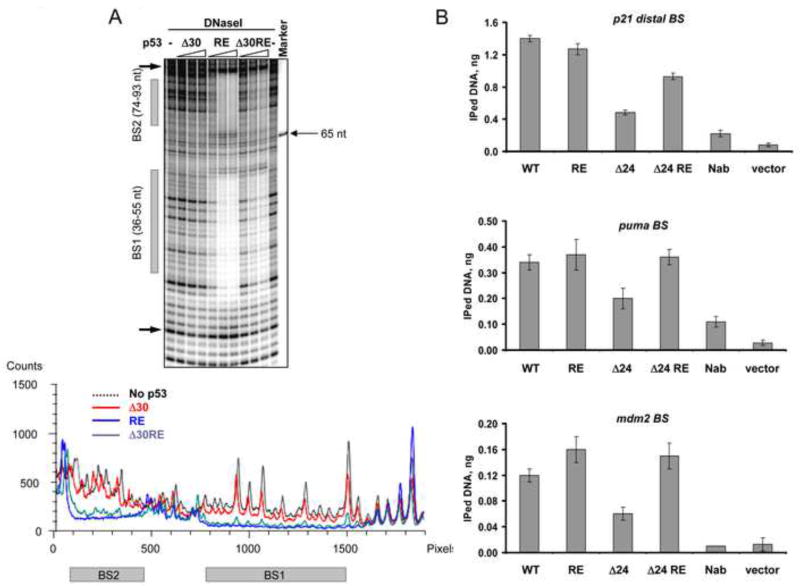
DNA binding by numerous transcription factors including the p53 tumor suppressor protein constitutes a vital early step in transcriptional activation. While the role of the central core DNA binding domain (DBD) of p53 in site-specific DNA binding has been established, the contribution of the sequence-independent C-terminal domain (CTD) is still not well understood. We investigated the DNA-binding properties of a series of p53 CTD variants using a combination of in vitro biochemical analyses and in vivo binding experiments. Our results provide several unanticipated and interconnected findings. First, the CTD enables DNA binding in a sequence-dependent manner that is drastically altered by either its modification or deletion. Second, dependence on the CTD correlates with the extent to which the p53 binding site deviates from the canonical consensus sequence. Third, the CTD enables stable formation of p53-DNA complexes to divergent binding sites via DNA-induced conformational changes within the DBD itself.


Figures

Figure 1
Figure 1. The p53 CTD is Required for Binding to Targets that Deviate from the Consensus Binding Sequence
(A). Schematic representation of p53 CTD variants expressed in H1299 cells. The positions of C-terminal lysines mutated to either arginine or glutamine are indicated below. Relative expression levels of p53 proteins used in the ChIP-on chip experiment are shown below. (B). Heat-map representation of ChIP-on-chip results. The vertical lines indicate the clustering of four groups of p53 target sites that were bound by the proteins indicated above each group. Indicated on the right of the heat map are group A, representing the sites bound by all p53 forms; B representing the sites bound by all p53 proteins other than the 6KQ; C representing the sites bound by WT and 6KR p53 variants; D representing the sites bound exclusively by WT p53. On the right is the correlation matrix corresponding to the heat map. (C). Venn diagram showing the total number of sites bound by each p53 variant and their relationship. (D). Average and standard error of p53 binding site scores (calculated by p53MH algorithm) for each distinct group. Group A score is significantly different from those of the other groups (P<0.006, 0.04 and 0.0002; two sides Student T test for groups B, C and D, respectively). See also Figure S1.
Figure 2
Figure 2. SELEX Reveals Substantial Differences in DNA Binding Site Selection Preferences of Wild Type and CTD-Modified Versions of p53
(A). Flow chart depicting the SELEX protocol used to generate the pool of DNA targets selected by p53 CTD variants. (B). Upper: BfaI and NlaIII restriction endonuclease cleavage sites compared with the core element of the p53 consensus BS. Lower: DNA pools selected by p53 CTD modified or mutated proteins (See also Figure S2) in rounds 1–4 (R1, R2, R3, and R4) of SELEX were digested with NlaIII and BfaI and the reaction products were separated by 10% TBE PAGE. The gel boundaries are indicated with dotted lines. R0 - the initial degenerate pool of DNA targets. Graphs on right show the fraction of enzyme-resistant DNA specific to each p53 variant after each round of SELEX. The fraction of NlaIII- and BfaI-sensitive DNA in R0 was found to be ~1–2%. (C). Δ30 p53 was bound to 66 bp 32P-labeled mdm2 DNA in the presence of increasing concentration of unlabeled DNA that was pre-selected by either WT or Δ30 p53 in the different rounds of SELEX. The left panel shows a compilation of 3 representative PhosphorImager scans of 4 % native 0.5X TBE polyacrylamide gels. The gel boundaries are indicated with dashed lines. No p53 lanes: no Δ30 p53 in the reaction. Initial - no unlabeled DNA competitor in the reactions. The fraction of the remaining Δ30 p53-mdm2 DNA complexes in each condition expressed as a function of competitor DNA is shown on the right.
Figure 3
Figure 3. The p53 CTD is Required for Stable p53-DNA Complex Formation in a Sequence-Dependent Manner
DNAseI footprint experiments with DNA fragments containing the BS from mdm2 (BS1 and BS2 weak sites, panel A), puma (intermediate site, panel B), or the p21 (strong distal BS, panel C) or mutated p21 distal BSs (panel D). The sequences of the original and two mutated p21 distal BS with changes in bold are shown on the top of gels in panel D. Each panel represents a portion of a high-resolution PhosphorImager scan of the 11 % sequencing PAAG with the positions of the corresponding BSs shown as gray bars on the left side of each scan. The arrows on the left side of each gel denote p53-specific DNaseI hypersensitive sites. Full site scanning densitometry analysis specific to each p53 variant at its maximal concentration is shown in Figure S4. Sequence-specific DNA markers were prepared and run on the gels along with the experimental reaction mixture (indicated by thin arrows on the right of side of the gel).
Figure 4
Figure 4. The p53 CTD Regulates Stability of p53-Cognate DNA Complexes
(A). Representative gel scan of a competition binding assay that was performed with 32P-labeled Δ30 p53 protein in presence of unlabeled mdm2 BS-containing DNA and increasing amounts of unlabeled p53 WT or CTD-altered proteins as specified. The labeled Δ30 p53 protein was visualized using a PhosphorImager and relative amounts of displaced Δ30 p53 in each reaction mixture (indicated with arrow) were estimated using ImageQuant 5.2 software and presented as fold increase over the values obtained with no p53 competitor in the corresponding graphs below each scan. (B). Graphs show the quantification of the competition binding experiments performed with 32P-end-labeled p21 (left panel) or mdm2 (right panel) BS-containing DNA fragments in the presence of either unlabeled WT or Δ30 p53 protein as indicated. The experiment was performed as described in Experimental Procedures.
Figure 5
Figure 5. C-Terminally Deleted or Modified p53 Variants can be Cross-Linked to the p21 more efficiently than the mdm2 Binding Site
WT, p300-acetylated p53 (Ac), 6KQ and Δ30 p53 proteins were bound to 32P end-labeled DNA fragments containing either p21 (A) or mdm2 (B) binding sites in which the UV cross-linkable nucleotide analogue 4-thio-dTTP was present at the indicated positions (shown in bold italics within the corresponding BS sequences). Following DNA-p53 complex formation, the reaction mixtures were subjected to UV-irradiation and then separated by 8% SDS PAGE. p53-DNA cross-linked products (X-link) were visualized using a PhosphorImager. Each panel shows a portion of the gel image (at left) and the corresponding graphical analyses (at right) of the relative intensities of each cross-link. The standard deviations were calculated from three parallel experiments.
Figure 6
Figure 6. The p53 CTD is Important for DNA-Induced Conformational Changes within the Central Specific DNA Binding Domain
(A). WT or Δ30 p53 proteins N-terminally labeled with 32P were incubated in the presence or absence of the indicated DNA fragments and then subjected to limited proteolysis with GluC endopeptidase for 3, 6, 12 or 24 min. The labeled cleavage products were separated by 10–20% gradient SDS TG PAGE and visualized using a Phosphorimager (left panels). The intensity of the indicated specific cleavage products of p53 was quantified using ImageQuant 5.2 (graphs on the right). (B). GluC cleavage products were identified by chemical and enzymatic mapping experiment whose details are described in Experimental Procedures using GluC, or LysC, a highly specific endopeptidase that cleaves predominantly at Lys-X; BrCN, a chemical protease that cleaves at Met-X where X is any amino acid. (C) Left: Position of the GluC cleavage sites in (A) within the full length p53 are schematically summarized in the left panel and are shown on the p53 structure (PDB 2AC0) on the right. See also Figure S6.
Figure 7
Figure 7. The E180R/R181E (RE) Double Mutation within the Central DNA Binding Domain Restores Interactions of CTD-Deleted p53 with Low Affinity Binding Sites in vitro and in vivo
(A). DNaseI footprinting analysis was performed on 32P-labeled mdm2 DNA (non-template strand labeled) with either Δ30 p53, full length RE or Δ30 RE p53 proteins. On top is shown a portion of the PhosphorImager scan of the sequencing gel around the indicated p53 binding sites and the corresponding densitometry analysis specific to each p53 variant indicated by different colors at their maximal concentration is shown below. (B). Empty vector or constructs expressing full length WT, full length RE, Δ24 and Δ24 RE p53 proteins under control of the endogenous p53 promoter as indicated were transfected into H1299 cells. 24 h post- transfection the cells were subjected to the ChIP protocol (see Experimental Procedures). p53-DNA complexes were immunoprecipitated with MAbs 1801 and DO.1. p53 binding to its sites within the p21, puma and mdm2 promoters was evaluated by real time quantitative PCR and expressed as amount of immunoprecipitated DNA. See also Figure S7.

Similar articles

Cited by

References

    1. An W, Kim J, Roeder RG. Ordered cooperative functions of PRMT1, p300, and CARM1 in transcriptional activation by p53. Cell. 2004;117:735–748. - PubMed
    1. Anderson ME, Woelker B, Reed M, Wang P, Tegtmeyer P. Reciprocal interference between the sequence-specific core and nonspecific C-terminal DNA binding domains of p53: implications for regulation. Mol. Cell. Biol. 1997;17:6255–6264. - PMC - PubMed
    1. Ayed A, Mulder FA, Yi GS, Lu Y, Kay LE, Arrowsmith CH. Latent and active p53 are identical in conformation. Nat. Struct. Biol. 2001;8:756–760. - PubMed
    1. Barlev NA, Liu L, Chehab NH, Mansfield K, Harris KG, Halazonetis TD, Berger SL. Acetylation of p53 activates transcription through recruitment of coactivators/histone acetyltransferases. Mol. Cell. 2001;8:1243–1254. - PubMed
    1. Beno I, Rosenthal K, Levitine M, Shaulov L, Haran TE. Sequence-dependent cooperative binding of p53 to DNA targets and its relationship to the structural properties of the DNA targets. Nucleic Acids Res. 2011;39:1919–1932. - PMC - PubMed

Publication types