

Preclinical activity of combined HDAC and KDM1A inhibition in glioblastoma
- PMID: 25795306
- PMCID: PMC4648298
- DOI: 10.1093/neuonc/nov041
Preclinical activity of combined HDAC and KDM1A inhibition in glioblastoma
Abstract
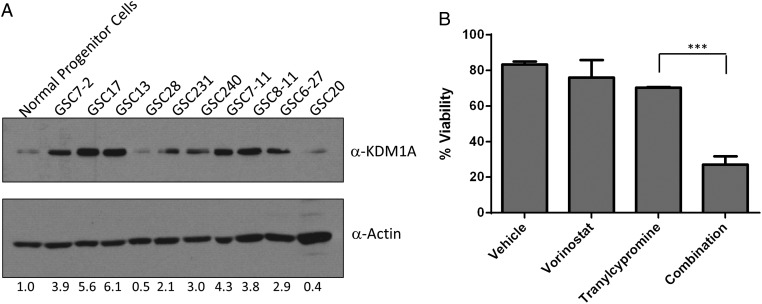
Background: Glioblastoma (GBM) is the most common and aggressive form of brain cancer. Our previous studies demonstrated that combined inhibition of HDAC and KDM1A increases apoptotic cell death in vitro. However, whether this combination also increases death of the glioma stem cell (GSC) population or has an effect in vivo is yet to be determined. Therefore, we evaluated the translational potential of combined HDAC and KDM1A inhibition on patient-derived GSCs and xenograft GBM mouse models. We also investigated the changes in transcriptional programing induced by the combination in an effort to understand the induced molecular mechanisms of GBM cell death.
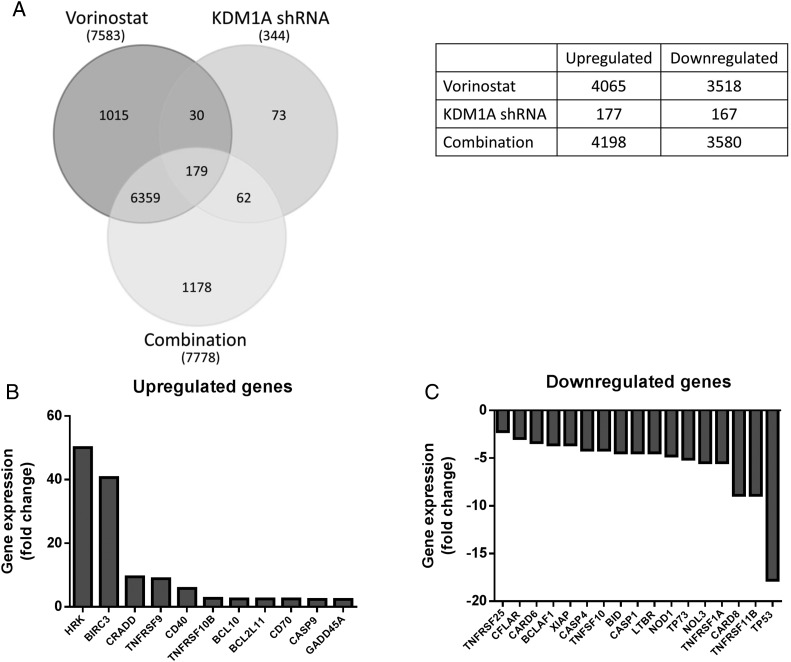
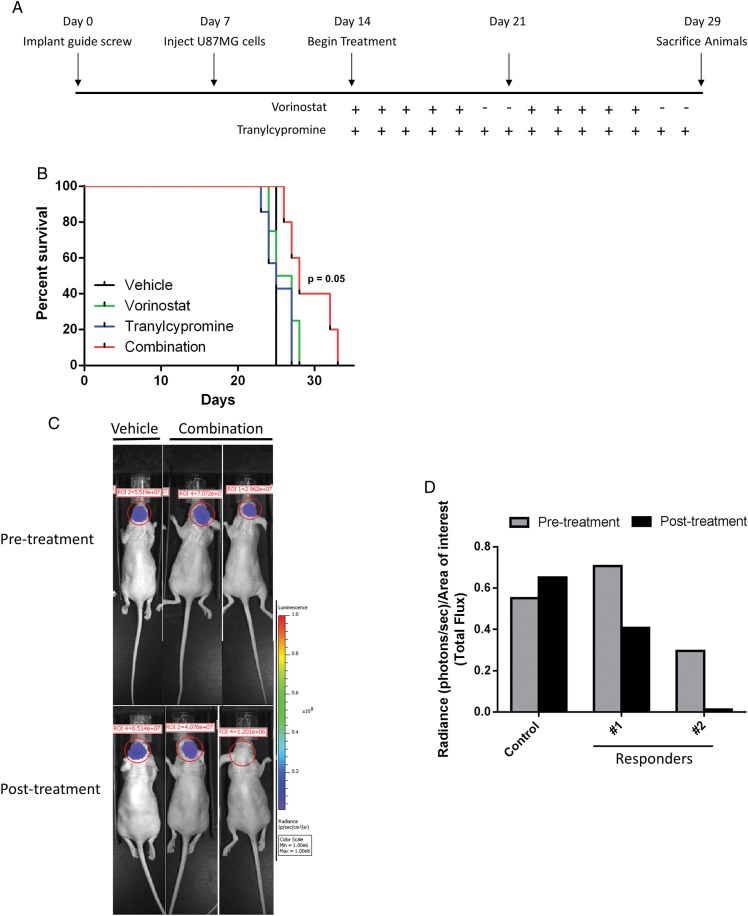
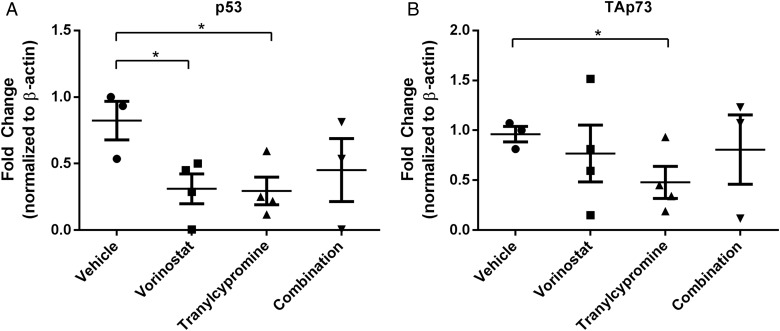
Methods: Patient-derived GSCs were treated with the combination of vorinostat, a pan-HDAC inhibitor, and tranylcypromine, a KDM1A inhibitor, and viability was measured. To characterize transcriptional profiles associated with cell death, we used RNA-Seq and validated gene changes by RT-qPCR and protein expression via Western blot. Apoptosis was measured using DNA fragmentation assays. Orthotopic xenograft studies were conducted to evaluate the effects of the combination on tumorigenesis and to validate gene changes in vivo.
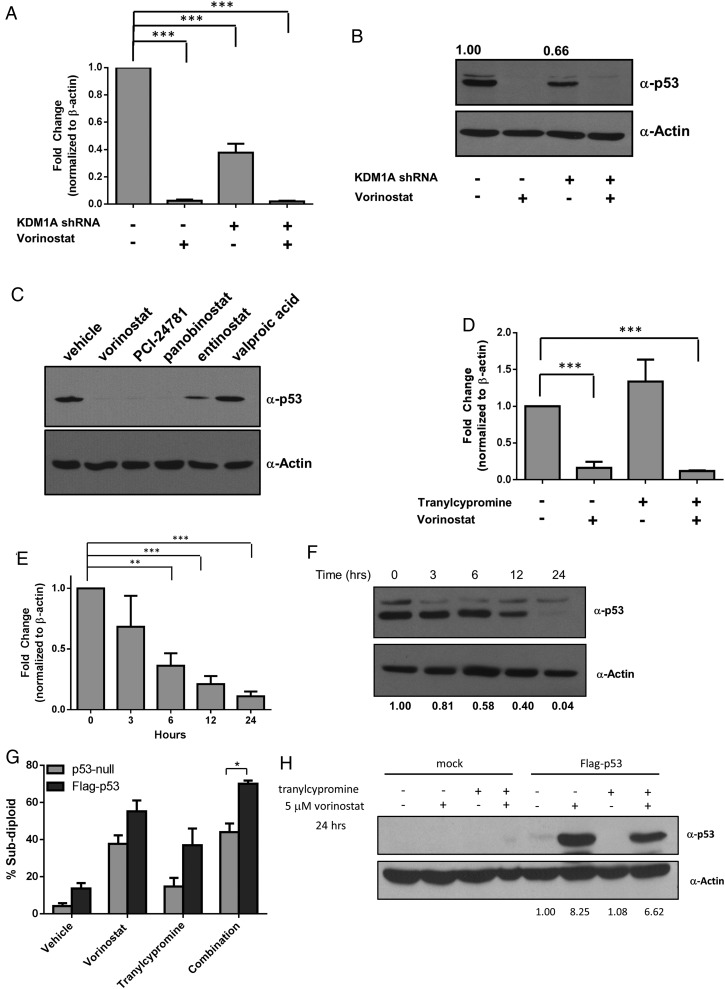
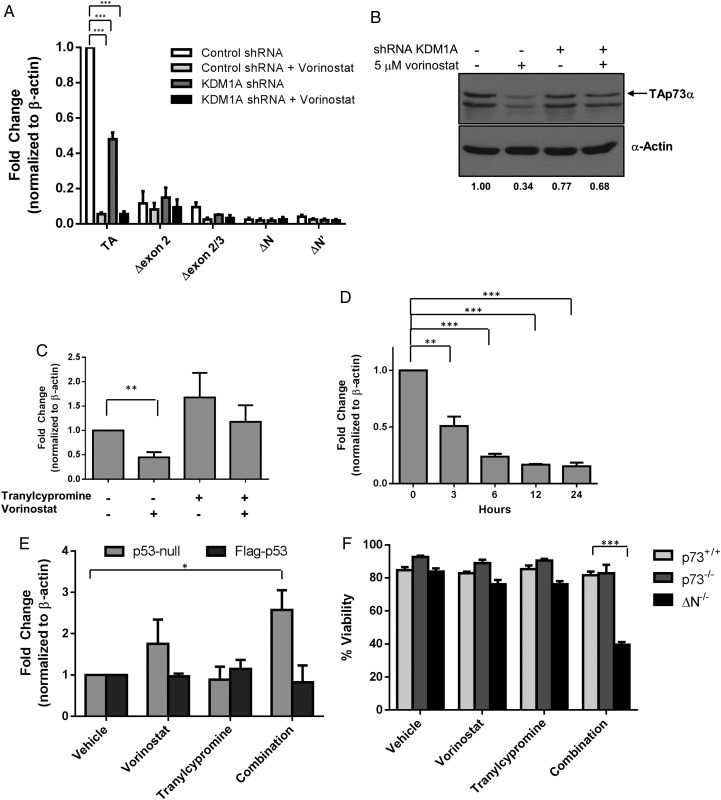
Results: The combination of vorinostat and tranylcypromine reduced GSC viability and displayed efficacy in the U87 xenograft model. Additionally, the combination led to changes in apoptosis-related genes, particularly TP53 and TP73 in vitro and in vivo.
Conclusions: These data support targeting HDACs and KDM1A in combination as a strategy for GBM and identifies TP53 and TP73 as being altered in response to treatment.
Keywords: HDAC inhibitors; KDM1A; LSD1; epigenetics; glioblastoma; lysine demethylases; orthotopic GBM models; tranylcypromine.
© The Author(s) 2015. Published by Oxford University Press on behalf of the Society for Neuro-Oncology. All rights reserved. For permissions, please e-mail: journals.permissions@oup.com.
Figures
Similar articles
-
Inhibition of LSD1 sensitizes glioblastoma cells to histone deacetylase inhibitors.Neuro Oncol. 2011 Aug;13(8):894-903. doi: 10.1093/neuonc/nor049. Epub 2011 Jun 8. Neuro Oncol. 2011. PMID: 21653597 Free PMC article.
-
Inhibition of TFEB oligomerization by co-treatment of melatonin with vorinostat promotes the therapeutic sensitivity in glioblastoma and glioma stem cells.J Pineal Res. 2019 Apr;66(3):e12556. doi: 10.1111/jpi.12556. Epub 2019 Feb 14. J Pineal Res. 2019. PMID: 30648757
-
Novel KDM1A inhibitors induce differentiation and apoptosis of glioma stem cells via unfolded protein response pathway.Oncogene. 2017 Apr 27;36(17):2423-2434. doi: 10.1038/onc.2016.395. Epub 2016 Nov 28. Oncogene. 2017. PMID: 27893719 Free PMC article.
-
Advances in histone deacetylase inhibitors in targeting glioblastoma stem cells.Cancer Chemother Pharmacol. 2020 Aug;86(2):165-179. doi: 10.1007/s00280-020-04109-w. Epub 2020 Jul 7. Cancer Chemother Pharmacol. 2020. PMID: 32638092 Review.
-
Role of Lysine-specific Demethylase 1 and Its Small Molecule Inhibitors in Glioblastoma Multiforme Therapy.Anticancer Agents Med Chem. 2022;22(18):3062-3085. doi: 10.2174/1871520622666220421092414. Anticancer Agents Med Chem. 2022. PMID: 35593350 Review.
Cited by
-
Mechanism of Action for HDAC Inhibitors-Insights from Omics Approaches.Int J Mol Sci. 2019 Apr 1;20(7):1616. doi: 10.3390/ijms20071616. Int J Mol Sci. 2019. PMID: 30939743 Free PMC article. Review.
-
Characterization of a new small-molecule inhibitor of HDAC6 in glioblastoma.Cell Death Dis. 2020 Jun 2;11(6):417. doi: 10.1038/s41419-020-2586-x. Cell Death Dis. 2020. PMID: 32488056 Free PMC article.
-
Rapid proteomic analysis for solid tumors reveals LSD1 as a drug target in an end-stage cancer patient.Mol Oncol. 2018 Aug;12(8):1296-1307. doi: 10.1002/1878-0261.12326. Epub 2018 Jun 14. Mol Oncol. 2018. PMID: 29901861 Free PMC article.
-
Enhanced efficacy of combined HDAC and PARP targeting in glioblastoma.Mol Oncol. 2016 May;10(5):751-63. doi: 10.1016/j.molonc.2015.12.014. Epub 2016 Jan 8. Mol Oncol. 2016. PMID: 26794465 Free PMC article.
-
Targeting Epigenetic Pathways in the Treatment of Pediatric Diffuse (High Grade) Gliomas.Neurotherapeutics. 2017 Apr;14(2):274-283. doi: 10.1007/s13311-017-0514-2. Neurotherapeutics. 2017. PMID: 28233220 Free PMC article. Review.
References
-
- Kahl P, Gullotti L, Heukamp LC, et al. Androgen receptor coactivators lysine-specific histone demethylase 1 and four and a half LIM domain protein 2 predict risk of prostate cancer recurrence. Cancer Res. 2006;66(23):11341–11347. - PubMed
Publication types
MeSH terms
Substances
Grants and funding
LinkOut - more resources
Full Text Sources
Other Literature Sources
Medical
Research Materials
Miscellaneous
