. 2015 Mar 20;15(3):14.
doi: 10.1167/15.3.14.

Continuous psychophysics: Target-tracking to measure visual sensitivity

Affiliations

Continuous psychophysics: Target-tracking to measure visual sensitivity

Kathryn Bonnen et al. J Vis. .

Abstract

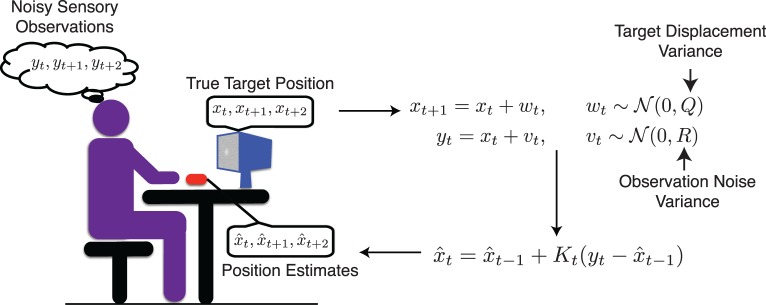
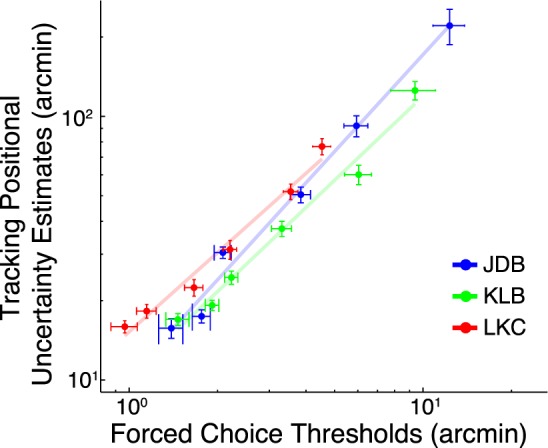
We introduce a novel framework for estimating visual sensitivity using a continuous target-tracking task in concert with a dynamic internal model of human visual performance. Observers used a mouse cursor to track the center of a two-dimensional Gaussian luminance blob as it moved in a random walk in a field of dynamic additive Gaussian luminance noise. To estimate visual sensitivity, we fit a Kalman filter model to the human tracking data under the assumption that humans behave as Bayesian ideal observers. Such observers optimally combine prior information with noisy observations to produce an estimate of target position at each time step. We found that estimates of human sensory noise obtained from the Kalman filter fit were highly correlated with traditional psychophysical measures of human sensitivity (R2 > 97%). Because each frame of the tracking task is effectively a "minitrial," this technique reduces the amount of time required to assess sensitivity compared with traditional psychophysics. Furthermore, because the task is fast, easy, and fun, it could be used to assess children, certain clinical patients, and other populations that may get impatient with traditional psychophysics. Importantly, the modeling framework provides estimates of decision variable variance that are directly comparable with those obtained from traditional psychophysics. Further, we show that easily computed summary statistics of the tracking data can also accurately predict relative sensitivity (i.e., traditional sensitivity to within a scale factor).

Keywords: Kalman filter; manual tracking; psychophysics; vision.


Figures

Figure 1
Figure 1
Examples of the stimuli are shown in the left column, and cross-sections (normalized intensity vs. horizontal position) are shown on the right.
Figure 2
Figure 2
Target position and subject response for a single tracking trial (left plot). The middle and right plots show the corresponding time series or the horizontal and vertical positions, respectively.
Figure 3
Figure 3
Heatmaps of the cross-correlations between the stimulus and response velocities. Left and Middle columns show horizontal and vertical response components, respectively. Each row of a subpanel represents an individual tracking trial, and the trials have been sorted by target blob width (measured in arcmin and labeled by color blocks that correspond with the curve colors in Figure 4); beginning with the most visible stimuli at the tops of each subpanel. The black lines trace the peaks of the CCGs. The right column shows the average of horizontal and vertical response correlations within a trial (i.e., average of left and middle columns).
Figure 4
Figure 4
Average CCGs for blob width (curve color, identified in the legend by their σ in arcmin) for each of the three observers (panel). The peak height, location of peak, and width of curve (however measured) all sort neatly by blob width, with the more visible targets yielding higher, prompter, and sharper curves. This shows that there is at least a qualitative agreement between measures of tracking performance and what would be expected from a traditional psychophysical experiment.
Figure 5
Figure 5
Illustration of the Kalman filter and our experiment. The true target positions and the estimates (cursor positions) are known, while the sensory observations, internal to the observer, are unknown. We estimated the variance associated with the latter, denoted by R, by maximizing the likelihood of the position estimates given the true target positions by adjusting R as a free parameter.
Figure 6
Figure 6
The left column shows the positional errors (response position−target position) over time of a subject's response (top) and three model responses (bottom, offset vertically for clarity); the black position error trace results from a roughly correct estimate of R. The right column shows the histograms of the positions from the first column. The distribution from the model output with the correct noise estimate (black), has roughly the same width as that from the human response (blue, top).
Figure 7
Figure 7
Positional uncertainty estimate from the Kalman filter analysis plotted as a function of the Gaussian blob width for three observers. Both axes are logarithmic. The pale colored regions indicate ±SEM computed by bootstrapping. The black line is the mean across the observers.
Figure 8
Figure 8
Timeline of a single trial. The task is a two interval forced-choice task. The stimuli were Gaussian blobs in a field of white Gaussian noise. Subjects were asked to indicate whether the second blob was presented to the left or right of the first blob.
Figure 9
Figure 9
Forced-choice threshold as a function of blob width. Each subject's average data are shown by the solid points, and the bands indicate bootstrapped SEM. Both axes are logarithmic. The solid black line shows the average across subjects.
Figure 10
Figure 10
Scatter plot of the position uncertainty estimated from the tracking experiment (y axis) as a function of the thresholds from traditional psychophysics (x axis) for our three observers. The log-log slope is very close to 1 and the percentage of variance accounted for is over 96% for each observer.
Figure 11
Figure 11
Threshold as a function of stimulus duration. Each subject's average data are shown by the solid points. Both axes are logarithmic. Data points and error bands are as in Figure 9. The gray line displays the performance of an ideal observer shifted up by a factor of 11.
Figure 12
Figure 12
Relationship between human observers and an ideal observer. Forced-choice human threshold estimates (left) and tracking noise estimates (right) are replotted (blue, green, and red lines). The ideal observers are depicted in black and the shifted ideal in gray.
Figure 13
Figure 13
The left panel depicts the CCGs for subject LKC sorted by blob width (identified in the legend by their σ in arcmin). The right panel shows the forced-choice estimates versus the CCG widths (of the positive-going Gaussians) from the tracking data. Error bars correspond to SEM.
Figure 14
Figure 14
Parameters (amplitude, lag, and width) are very highly correlated. From the left to right, the panels represent: lag versus amplitude, width versus lag, and amplitude versus width. The correlation coefficients that correspond to each of these relationships are inset in each panel. These parameters are calculated from observer LKC's data.
Figure A1
Figure A1
Estimated uncertainty ( formula image 
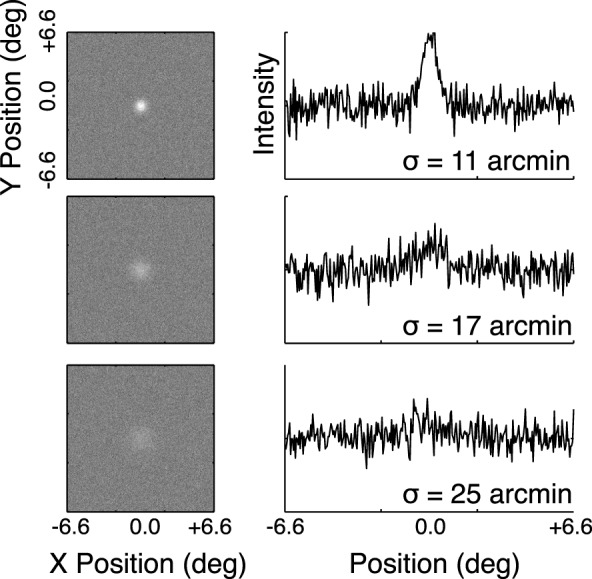
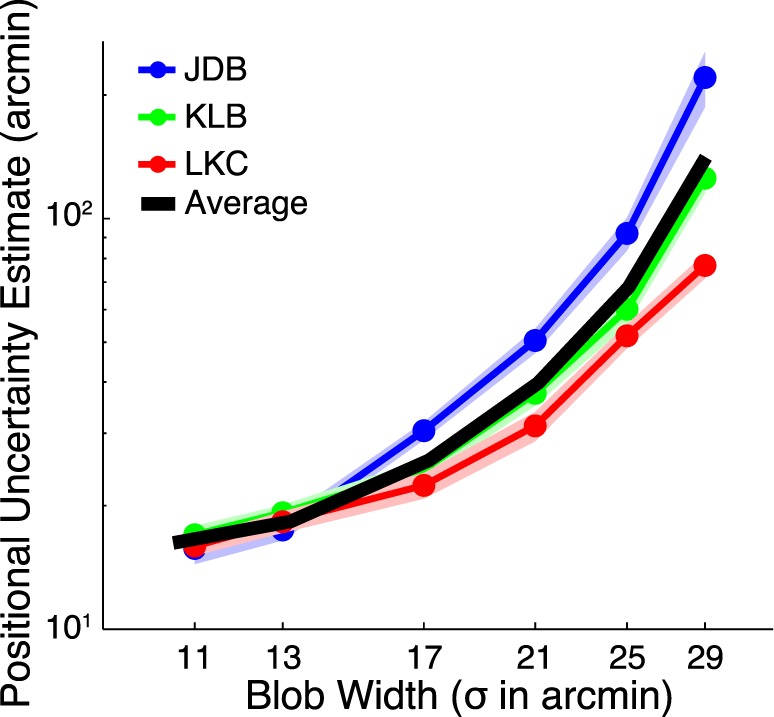
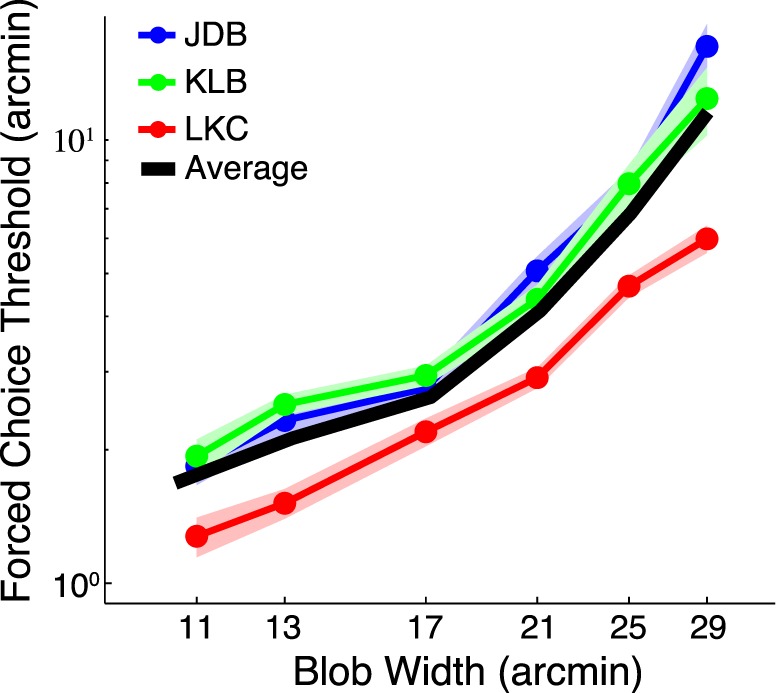
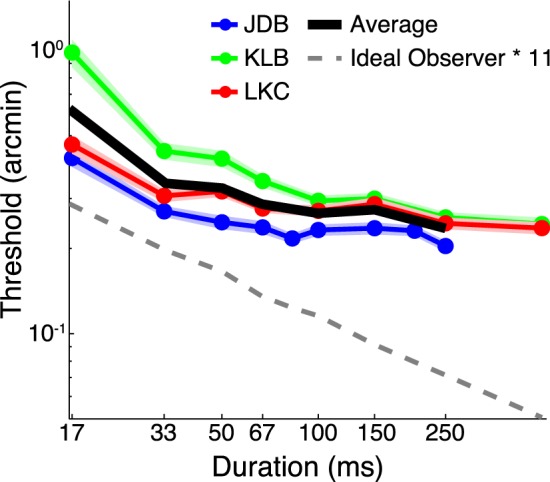
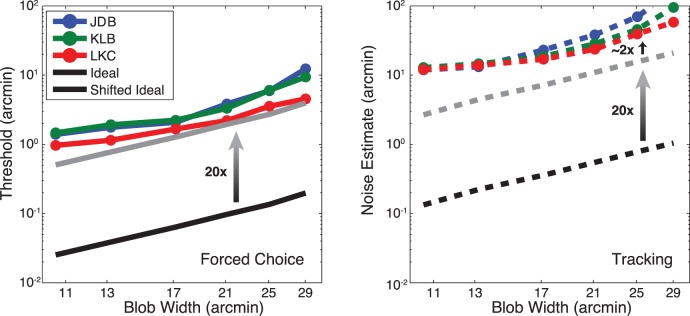
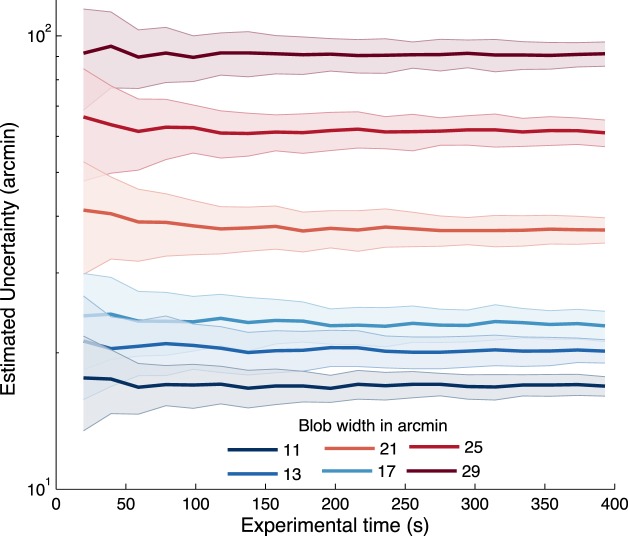
) versus experimental time used to estimate R. Error bounds show ±SEM. Blob width is indicated by curve color and identified in the legend by its σ in arcmin.

References

    1. Ackermann J. F., Landy M. S. (2010). Suboptimal choice of saccade endpoint in search with unequal payoffs. Journal of Vision , 10 (7): 14, http://www.journalofvision.org/content/10/7/530, doi:10.1167/10.7.530. [Abstract] - DOI
    1. Berniker M., Kording K. (2008). Estimating the sources of motor errors for adaptation and generalization. Nature Neuroscience , 11 (12), 1454– 1461. - PMC - PubMed
    1. Brainard D. H. (1997). The psychophysics toolbox. Spatial Vision , 10, 433– 436. - PubMed
    1. Brett J. (1987). Goldilocks and the three bears (Retold and illustrated). New York: Dodd Mead.
    1. Brueggemann J. (2007). The hand is NOT quicker than the eye. Journal of Vision , 7 (15): 14, http://www.journalofvision.org/content/7/15/54, doi:10.1167/7.15.54. (Note: Actual authors were J. Brueggerman and S. Stevenson, but the latter was omitted from the published abstract by mistake.) - DOI

Publication types