Comparative Study
. 2015 May 30;232(2):175-83.
doi: 10.1016/j.pscychresns.2015.02.008. Epub 2015 Feb 27.

Cerebral perfusion differences in women currently with and recovered from anorexia nervosa

Affiliations
Comparative Study

Cerebral perfusion differences in women currently with and recovered from anorexia nervosa

Min Sheng et al. Psychiatry Res. .

Abstract

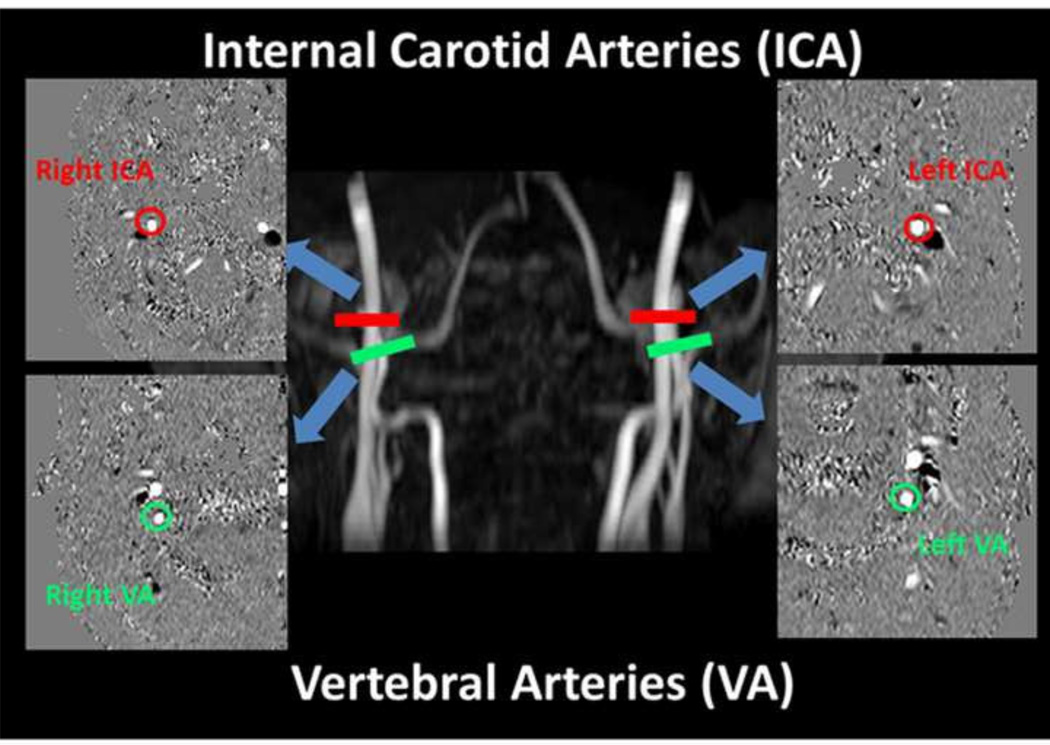
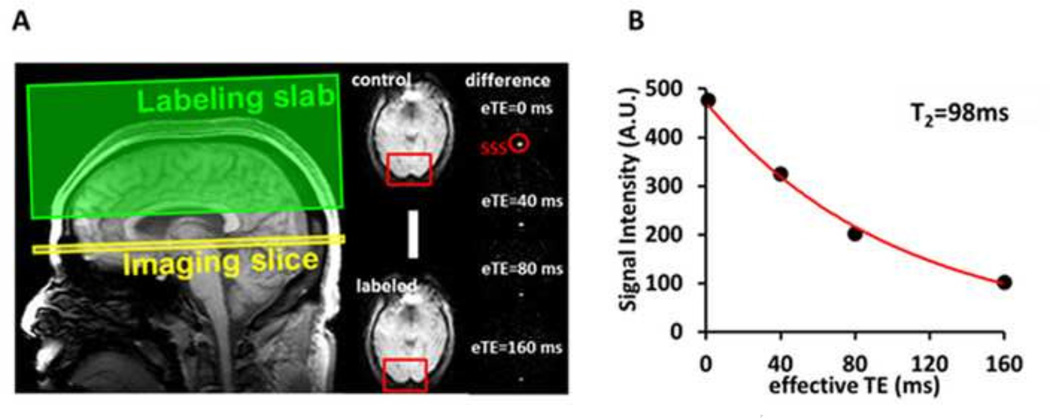
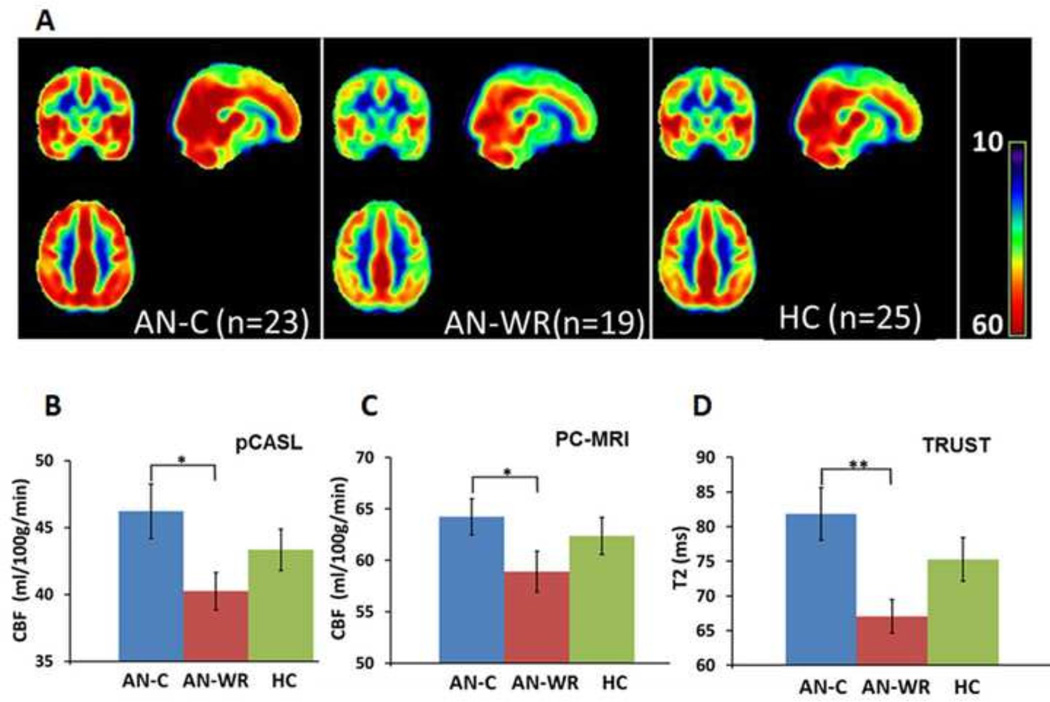
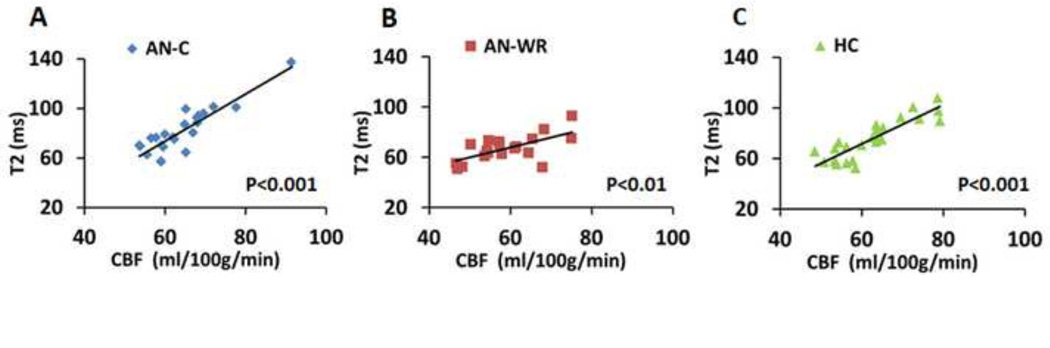
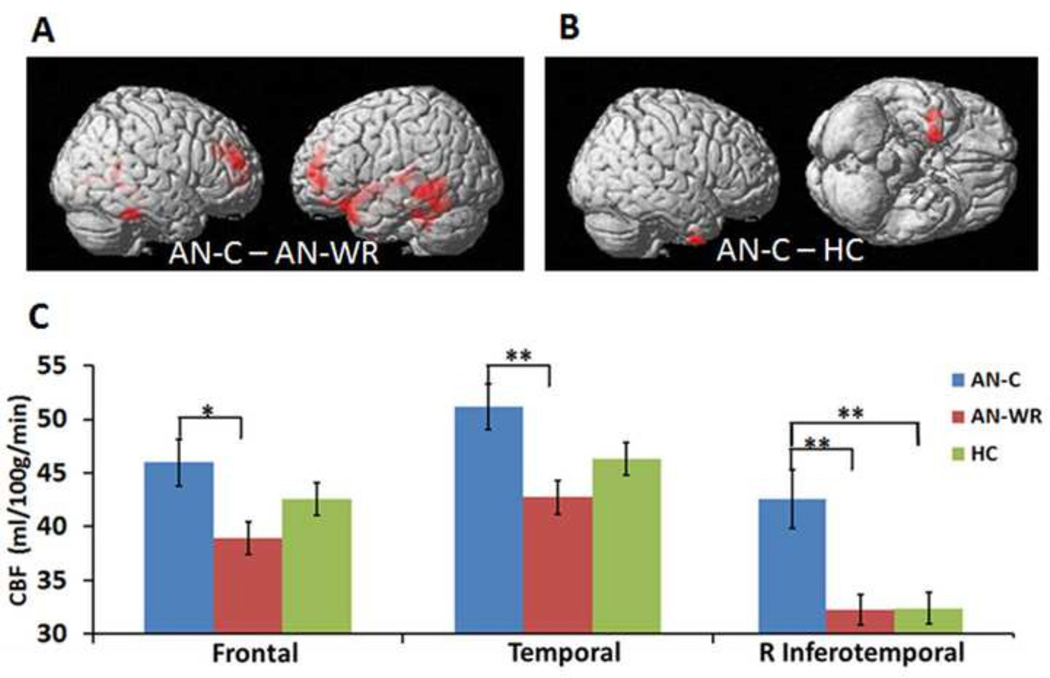
Anorexia nervosa is a serious psychiatric disorder characterized by restricted eating, a pursuit of thinness, and altered perceptions of body shape and size. Neuroimaging in anorexia nervosa has revealed morphological and functional alterations in the brain. A better understanding of physiological changes in anorexia nervosa could provide a brain-specific health marker relevant to treatment and outcomes. In this study, we applied several advanced magnetic resonance imaging (MRI) techniques to quantify regional and global cerebral blood flow (CBF) in 25 healthy women (HC), 23 patients currently with anorexia (AN-C) and 19 patients in long-term weight recovery following anorexia (AN-WR). Specifically, CBF was measured with pseudo-continuous arterial spin labeling (pCASL) MRI and then verified by a different technique, phase contrast (PC) MRI. Venous T2 values were determined by T2 relaxation under spin tagging (TRUST) MRI, and were used to corroborate the CBF results. These novel techniques were implemented on a standard 3T MRI scanner without any exogenous tracers, and the total scan duration was less than 10min. Voxel-wise comparison revealed that the AN-WR group showed lower CBF in bilateral temporal and frontal lobes than the AN-C group. Compared with the HC group, the AN-C group also showed higher CBF in the right temporal lobe. Whole-brain-averaged CBF was significantly decreased in the AN-WR group compared with the AN-C group, consistent with the PC-MRI results. Venous T2 values were lower in the AN-WR group than in the AN-C group, consistent with the CBF results. A review of prior work examining CBF in anorexia nervosa is included in the discussion. This study identifies several differences in the cerebral physiological alterations in anorexia nervosa, and finds specific differences relevant to the current state of the disorder.

Keywords: Arterial spin labeling; Cerebral blood flow; Eating disorders; MRI; Phase contrast; T(2) relaxation under spin tagging (TRUST).


Figures

Fig. 1
Fig. 1
Slice positions and typical results of phase-contrast (PC) MRI for the quantification of global CBF. Four PC MRI scans, red bars for internal carotid arteries (ICA) and green bars for vertebral arteries (VA) are positioned perpendicular to the respective feeding arteries on an angiogram image (shown in the middle). The corresponding PC MR images for each artery are shown in the side panels, with the blue arrows directing to each artery. The phase images of the target arteries (circled) always appear in the center of the image and are easily identified.
Fig. 2
Fig. 2
Measurement of venous T2 value using T2 relaxation under spin tagging (TRUST) MRI. A. Left figure illustrates imaging slice (yellow) and labeling slab (green) of the TRUST scan. Middle panels show raw images of control and labeled scans. The red boxes illustrate the manually drawn region of interest of the superior sagittal sinus (SSS). Right panels show difference images, i.e. control-labeled. eTE = effective echo time. Red circle highlights the location of the SSS. B. Monoexponential fitting of the signal intensity in SSS as a function of eTE yields blood T2 value.
Fig. 3
Fig. 3
Whole-brain cerebral blood flow. A. Group-averaged CBF maps for AN-C, AN-WR, and HC groups. CBF differences are visually apparent in bilateral frontal and temporal lobes. B. Mean CBF of each group using pCASL technique. C. Mean CBF of each group using PC-MRI technique. D. Mean T2 values for each group using TRUST technique. For BCD, the AN-C mean is in blue, the AN-WR mean in red, and the HC mean in green. The error bar is the standard error of the mean. One asterisk corresponds to P ≤0.05; two asterisks indicate P<0.01.
Fig. 4
Fig. 4
Scatter plots correlating the T2 values and the CBF obtained using PC-MRI for individual subjects. A. AN-C subjects. B. AN-WR subjects. C. HC subjects. There are strong correlations for all three groups.
Fig. 5
Fig. 5
Regional cerebral blood flow. A. Whole-brain voxel-wise t-test for the AN-C and AN-WR groups. Red regions are those with significantly higher CBF in the AN-C group relative to the AN-WR; differences are primarily in the bilateral temporal and frontal lobes. B. Whole-brain voxel-wise t-test for the AN-C and HC groups. The red region in the inferotemporal cortex has significantly higher CBF in the AN-C group relative to the HC group. For both A and B, significance threshold for differences was set at cluster PFWE < 0.001. C. ROI analysis for frontal lobe, temporal lobe and right inferior temporal gyrus. The AN-C group mean is in blue, the AN-WR group mean in red, and the HC group mean in green. Error bar is the standard error of the mean. One asterisk corresponds to P ≤0.05; two asterisks indicate P<0.01.

Similar articles

Cited by

References

    1. Ainslie PN, Ogoh S. Regulation of cerebral blood flow in mammals during chronic hypoxia: a matter of balance. Experimental Physiology. 2010;95:251–262. - PubMed
    1. Aslan S, Lu H. On the sensitivity of ASL MRI in detecting regional differences in cerebral blood flow. Magnetic Resonance Imaging. 2010;28:928–935. - PMC - PubMed
    1. Aslan S, Xu F, Wang PL, Uh J, Yezhuvath US, van Osch M, Lu H. Estimation of labeling efficiency in pseudocontinuous arterial spin labeling. Magnetic Resonance in Medicine. 2010;63:765–771. - PMC - PubMed
    1. American Psychiatric Association. Diagnostic and Statistical Manual of Mental Disorders. 4th ed. Washington, DC: Author; 1994.
    1. Bailer UF, Kaye WH. Serotonin: imaging findings in eating disorders. Current topics in Behavioral Neuroscience. 2011;6:59–79. - PMC - PubMed

Publication types

LinkOut - more resources