. 2015 May 1;290(18):11749-61.
doi: 10.1074/jbc.M114.619833. Epub 2015 Mar 20.

A novel dual kinase function of the RET proto-oncogene negatively regulates activating transcription factor 4-mediated apoptosis

Affiliations

A novel dual kinase function of the RET proto-oncogene negatively regulates activating transcription factor 4-mediated apoptosis

Rozita Bagheri-Yarmand et al. J Biol Chem. .

Abstract

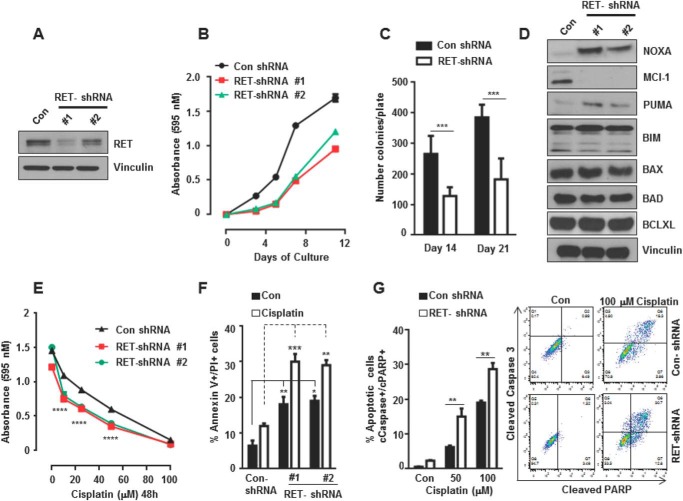
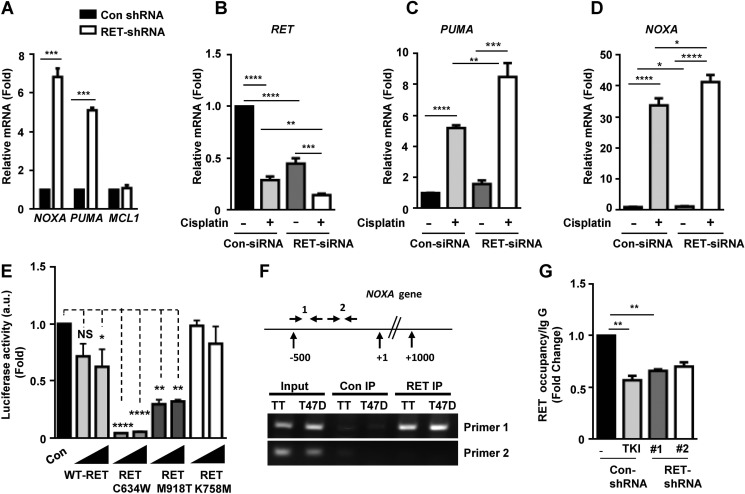
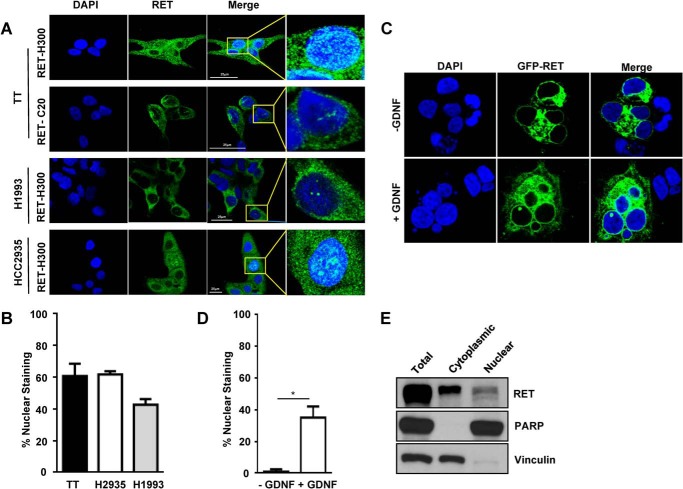
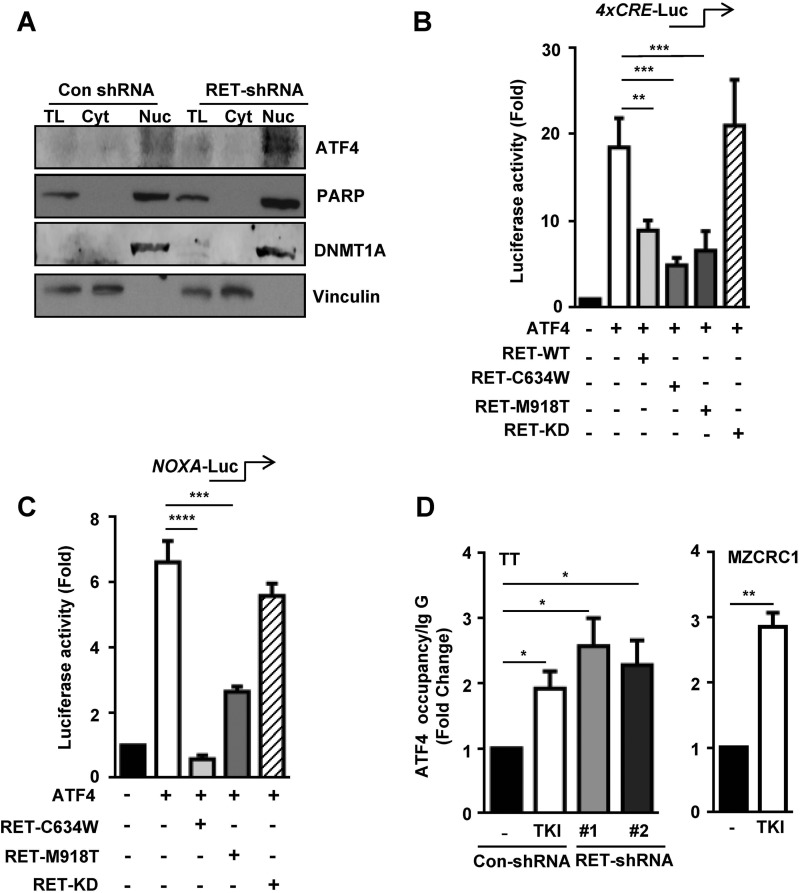
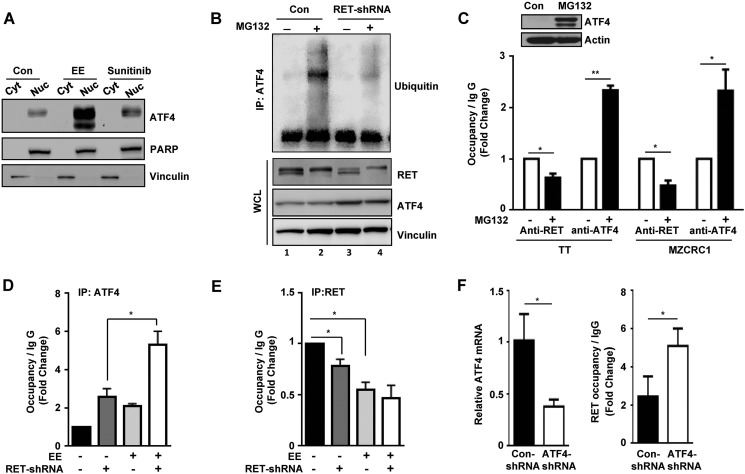
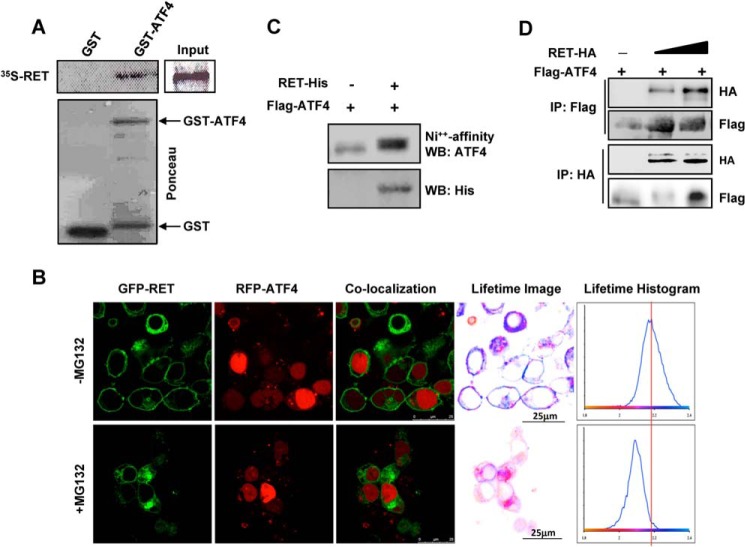
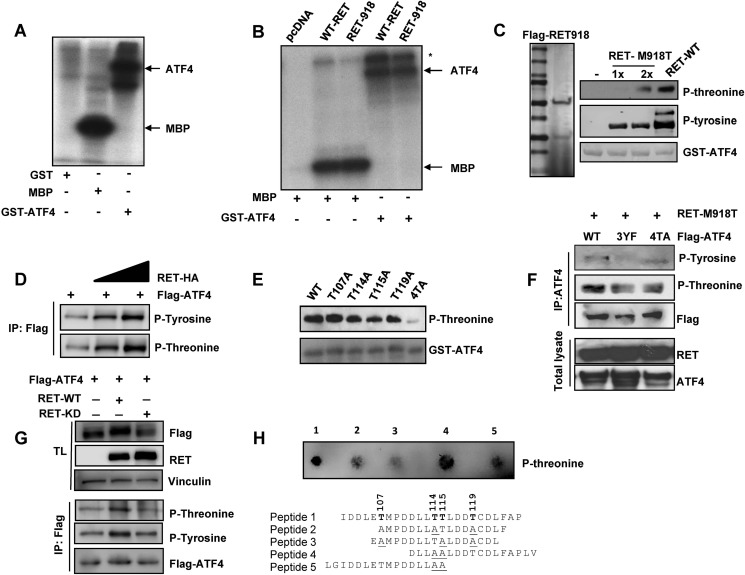
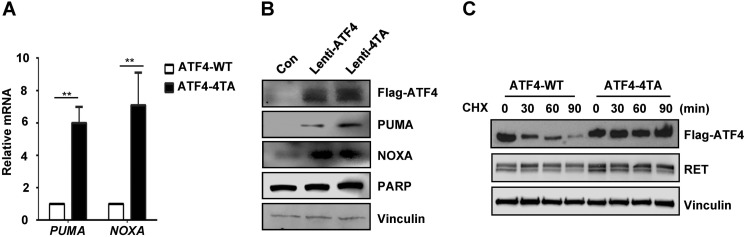
The RET proto-oncogene, a tyrosine kinase receptor, is widely known for its essential role in cell survival. Germ line missense mutations, which give rise to constitutively active oncogenic RET, were found to cause multiple endocrine neoplasia type 2, a dominant inherited cancer syndrome that affects neuroendocrine organs. However, the mechanisms by which RET promotes cell survival and prevents cell death remain elusive. We demonstrate that in addition to cytoplasmic localization, RET is localized in the nucleus and functions as a tyrosine-threonine dual specificity kinase. Knockdown of RET by shRNA in medullary thyroid cancer-derived cells stimulated expression of activating transcription factor 4 (ATF4), a master transcription factor for stress-induced apoptosis, through activation of its target proapoptotic genes NOXA and PUMA. RET knockdown also increased sensitivity to cisplatin-induced apoptosis. We observed that RET physically interacted with and phosphorylated ATF4 at tyrosine and threonine residues. Indeed, RET kinase activity was required to inhibit the ATF4-dependent activation of the NOXA gene because the site-specific substitution mutations that block threonine phosphorylation increased ATF4 stability and activated its targets NOXA and PUMA. Moreover, chromatin immunoprecipitation assays revealed that ATF4 occupancy increased at the NOXA promoter in TT cells treated with tyrosine kinase inhibitors or the ATF4 inducer eeyarestatin as well as in RET-depleted TT cells. Together these findings reveal RET as a novel dual kinase with nuclear localization and provide mechanisms by which RET represses the proapoptotic genes through direct interaction with and phosphorylation-dependent inactivation of ATF4 during the pathogenesis of medullary thyroid cancer.

Keywords: Apoptosis; Thyroid; Transcription Regulation; Transcription Repressor; Tyrosine-Protein Kinase (Tyrosine Kinase); Ubiquitylation (Ubiquitination).


Figures

FIGURE 1.
FIGURE 1.
RET knockdown decreases cell survival and sensitizes cells to cisplatin-induced cell death. A, Western blot analysis showing efficiency of RET knockdown in RET shRNA TT cells (clone 1 and clone 2) compared with control (Con). Vinculin served as a loading control. B, cell viability was measured by an MTT assay in control shRNA and RET shRNA TT cells at the indicated time points. Shown are the mean and S.D. (error bars) of six replicates in a representative experiment. C, RET knockdown inhibits anchorage-independent growth. Control and RET shRNA 1 cells were seeded in soft agar, and colonies were counted after 2 and 3 weeks. Data are presented as mean and S.D. of six replicates in a representative experiment (Student's t test). D, Western blot showing levels of apoptotic and survival proteins in control and RET shRNA TT cells. E, MTT assay for cell viability in RET shRNA and control shRNA cells treated with cisplatin at the indicated dose for 48 h. Shown are mean and S.D. of six replicates in a representative experiment. Two-way analyses of variance and Bonferroni's multiple comparison tests were used. F, quantification of apoptotic and dead cells using an annexin V/propidium iodide assay in control shRNA and RET shRNA TT cells after treatment with cisplatin (20 μm) for 24 h. Two-way analyses of variance and Bonferroni's multiple comparison tests were used. G, cleaved caspase-3/cleaved PARP-positive cells were quantified using flow cytometry after treatment with cisplatin at the indicated concentrations for 24 h (right panels). Data are shown as means ± S.D. from three independent experiments (left panel). The statistical analysis used was two-way analysis of variance, Tukey's multiple comparison test. Asterisk indicates p value, *, p < 0.05; **, p < 0.01; ***, p < 0.001.
FIGURE 2.
FIGURE 2.
RET represses NOXA and PUMA expression and NOXA promoter activity. A, quantitative real-time PCR showing mRNA levels of NOXA, PUMA, and MCL-1 in control shRNA and RET shRNA 1 TT cells using S18 mRNA as internal control. Data are shown as means ± S.D. (error bars) performed in triplicate from three independent experiments (Asterisk indicates p value, ***, p = 0.0006, Student's t test). B–D, MZCRC1 cells were transfected with control and RET siRNAs for 48 h and treated with cisplatin (100 μm) for 24 h. Quantitative real-time PCR shows mRNA levels of RET (B), PUMA (C), and NOXA (D) in control siRNA and RET siRNA cells. Values were normalized against HPRT mRNA levels. Shown are means ± S.D. of triplicates from two independent experiments (unpaired Student's t test). E, RET kinase activity is required for repression of NOXA promoter activity. Reporter assays in transfected HEK293T cells with the NOXA reporter and increasing amounts of WT RET, active mutant RET (RETC634W, RET-M918T), or kinase-dead mutant RET (RET-K758A) plasmids. Normalized luciferase enzyme activity (a.u. indicates arbitrary units) is presented as mean ± S.D. of triplicate samples from one representative experiment. F, schematic of the NOXA locus and the primers used in ChIP experiments. Shown is the ChIP assay for RET occupancy at the NOXA gene in TT cells and breast cancer T47D cells. RET occupancy was observed within a region close to the proximal NOXA promoter as amplified by primer set 1 (primer set 1 amplifies a genomic region −500 bp from the transcription start site; primer set 2 amplifies a genomic region +500 bp from the transcription start site. G, ChIP assays indicating RET occupancy at the NOXA promoter in TT cells treated with TKI (10 μm vandetanib for 8 h) and RET shRNA TT cells. Data are shown as means ± S.D. from two independent experiments. The statistical analysis used was unpaired Student's t test; **, p = 0.0048.
FIGURE 3.
FIGURE 3.
RET nuclear localization in cancer cells. A, immunostaining of RET in TT cells and non-small lung cancer cell lines with the indicated RET antibodies. Scale bars are indicated by the white lines. B, quantification of RET-positive cells with nuclear staining. Approximately 200–300 cells were counted at ×20 magnification in five different fields for each cell line. Data are means ± S.D. (error bars) from two independent experiments. C, HEK 293T cells were transfected with WT GFP-RET and treated with soluble coreceptor GFRα1 and glial cell-derived neurotropic factor (GDNF) (100 ng/ml) for 15 min and stained with DAPI. D, quantification of cells showing nuclear RET as performed in B. E, Western blot analysis for RET in nuclear and cytoplasmic fractions of TT cells. Vinculin and PARP were used as cytoplasmic and nuclear markers, respectively. Asterisks indicate p value, *, p < 0.05.
FIGURE 4.
FIGURE 4.
RET negatively regulates the ATF4 transcriptional activity. A, nuclear retention of ATF4 in RET shRNA TT cells. PARP and DNMT1A (DNA methyl transferase) were used as nuclear markers, and vinculin was used as a cytoplasmic marker. TL, total lysates; Cyt, cytoplasmic fraction; Nuc, nuclear fraction. B and C, RET inhibits ATF4-dependent gene activation. Shown are reporter assays with HEK293T cells transfected with the 4xCRE-Luc reporter (B) and the NOXA-Luc reporter (C) along with expression vectors encoding ATF4-WT, RET-WT, mutant RET (RET-C634W, RET-M918T), and RET kinase-dead mutant (RET-KD). D, ChIP assays indicating ATF4 occupancy at the NOXA promoter in TT cells treated with TKI (10 μm vandetanib for 8 h) and RET shRNA TT cells (left); MZCRC1 cells were treated with 10 μm sunitinib for 8 h (right). Data are shown as means ± S.D. (error bars) from two independent experiments. The statistical analysis used was unpaired Student's t test. Asterisks indicate p value, *, p < 0.05; **, p < 0.01; ***, p < 0.001; ****, p < 0.0001.
FIGURE 5.
FIGURE 5.
RET mediates suppression of apoptotic target genes through ubiquitination and degradation of ATF4. A, nuclear retention of ATF4 after eeyarestatin (EE) (10 μm for 8 h) or TKI treatment (10 μm sunitinib for 8 h) compared with untreated controls (Con). PARP and vinculin were used as nuclear and cytoplasmic markers, respectively. B, ubiquitination of ATF4 in control shRNA and RET shRNA 1 TT cells in the presence or absence of 10 μm MG132 for 8 h. Western blot showing polyubiquitinated ATF4 with ubiquitin and levels of RET and ATF4 in whole cell lysates (WCL). C, stabilization of ATF4 decreased the RET occupancy but increased the ATF4 occupancy in the NOXA promoter. Top, Western blot showing levels of ATF4 in lysate of TT cells treated with MG132 (5 μm) for 16 h. TT and MZCRC1 cells were treated with MG132 (5 μm) for 16 h and subjected to ChIP assays using anti-RET and anti-ATF4 antibodies. DMSO-treated cells were used as control. -Fold changes shown are the means ± S.D. (error bars) of two independent experiments (Student's t test). D and E, depletion of RET by shRNA or treatment with eeyarestatin increased ATF4 recruitment to the NOXA promoter. Shown are ChIP assays for occupancies of ATF4 (D) and RET (E) in control shRNA-TT cells or RET shRNA TT cells with or without treatment with eeyarestatin (10 μm for 8 h). Data are shown as means ± S.D. from two independent experiments (Student's t test). F, left, levels of ATF4 mRNA in control and ATF4 shRNA TT cells measured by quantitative PCR. Right, ChIP assays indicating RET occupancy at the NOXA promoter in control and ATF4 shRNA TT cells. Data are means ± S.D. from two independent experiments (Student's t test). *, p < 0.05; **, p < 0.01.
FIGURE 6.
FIGURE 6.
RET interacts with ATF4. A, in vitro GST pull-down assay with 35S-labeled RET-C634W proteins in the presence of GST and GST-ATF4. B–D, interactions between RET and ATF4 in cells; B, FRET between RET and ATF4 was measured using FLIM after transfection in HEK293T cells treated with 5 μm MG132 for 16 h. Confocal images and co-localization of the same field are shown (left). The histograms as shown (right) indicate the average fluorescence lifetime distributions corresponding to cells in the field of view. Lifetime images were generated by pixel-by-pixel mapping of the lifetime data and are represented as false color images adjacent to histograms. Scale bars are indicated by the white line. C, ATF4 was co-purified with RET. HEK293T cells were transfected with His-RET- kinase domain (residues 657–1114) and FLAG-ATF4 followed by purification of RET with nickel beads and then Western blot (WB) with ATF4 or His tag antibodies. D, RET was co-immunoprecipitated (IP) with ATF4. FLAG-ATF4 and HA-tagged full-length WT RET were expressed in HEK293T cells followed by reversed immunoprecipitation and Western blot with the indicated antibodies.
FIGURE 7.
FIGURE 7.
RET phosphorylates ATF4. A, kinase assay was performed using immunopurified RET from TT cell lysates with GST-ATF4 and myelin basic protein (MBP) as substrates. [32P]ATP served as a phosphate donor in the kinase assay. SDS-PAGE followed by autoradiography demonstrates specific phosphorylation of both proteins by RET. B, kinase assays were performed as in A with immunopurified full-length WT-RET and M918T mutant RET derived from transfected HEK293T cells. *, RET autophosphorylation. C, a tandem affinity-purified RET phosphorylates both tyrosine and threonine residues. Purification of RET-M918T enzyme (residues 657–1114) from transfected HEK293T cells was carried out with Ni2+ beads followed by a second affinity selection with FLAG antibody-agarose beads to yield a highly purified RET polypeptide on SDS-PAGE (left). A kinase assay was performed with purified RET-M918T and commercial wild type RET (Millipore) along with GST-ATF4 as a substrate and cold ATP, followed by Western blot analysis with phosphothreonine and phosphotyrosine antibodies (right panels). A gel stained with Ponceau indicates the levels of GST-ATF4. D, RET phosphorylates ATF4 in vivo. FLAG-ATF4 was expressed in HEK293T cells along with increasing amounts of full-length HA-RET. ATF4 phosphorylation was analyzed after immunoprecipitation (IP) and then Western blot with phospho-specific antibodies as indicated. E, mutation of targeted threonine residues reduces ATF4 phosphorylation. Shown is an in vitro kinase assay with GST-ATF4 and mutant GST-ATF4 in the presence of commercially obtained RET active enzyme. GST antibody was used as a control. F, in vivo phosphorylation of mutant ATF4. HEK293T cells were transfected with ATF4–4TA and ATF4–3YF along with RET-M918T (residues 657–1114) followed by immunoprecipitation with ATF4 antibody and Western blot with the indicated antibodies. G, decreased ATF4 phosphorylation in RET-KD-expressing cells. HEK293T cells were transfected with FLAG-ATF4 along with full-length RET-WT and RET-KD followed by immunoprecipitation with FLAG antibody and Western blot with the indicated antibodies. H, RET phosphorylates threonine residue. Peptides after incubation with purified RET wild type with the kinase domain (residues 657–1114) were spotted on nitrocellulose and then incubated with phosphothreonine antibody.
FIGURE 8.
FIGURE 8.
Threonine phosphorylation of ATF4 regulates its activity. A, quantitative RT-PCR shows mRNA levels of ATF4 targets NOXA and PUMA in TT cells expressing lentiviral ATF4-WT or ATF4–4TA. Error bars, S.D. values from two independent experiments. **, p < 0.01. B, Western blot analysis shows levels of indicated proteins in TT cells expressing lentiviral ATF4-WT or ATF4–4TA for 24 h. Vinculin served as a loading control. C, Western blot analysis indicates the levels of lentivirus-mediated expression of ATF4-WT and ATF4–4TA in TT cells after treatment with cycloheximide (CHX) (100 μg/ml) for the indicated periods using anti-FLAG, anti-RET, and anti-vinculin antibodies.

References

    1. Wells S. A., Jr., Santoro M. (2009) Targeting the RET pathway in thyroid cancer. Clin. Cancer Res. 15, 7119–7123 - PubMed
    1. Zeng Q., Cheng Y., Zhu Q., Yu Z., Wu X., Huang K., Zhou M., Han S., Zhang Q. (2008) The relationship between overexpression of glial cell-derived neurotrophic factor and its RET receptor with progression and prognosis of human pancreatic cancer. J. Int. Med. Res. 36, 656–664 - PubMed
    1. Ohshima Y., Yajima I., Takeda K., Iida M., Kumasaka M., Matsumoto Y., Kato M. (2010) c-RET molecule in malignant melanoma from oncogenic RET-carrying transgenic mice and human cell lines. PLoS One 5, e10279. - PMC - PubMed
    1. Díaz-Beyá M., Navarro A., Ferrer G., Díaz T., Gel B., Camós M., Pratcorona M., Torrebadell M., Rozman M., Colomer D., Monzo M., Esteve J. (2013) Acute myeloid leukemia with translocation (8;16)(p11;p13) and MYST3-CREBBP rearrangement harbors a distinctive microRNA signature targeting RET proto-oncogene. Leukemia 27, 595–603 - PubMed
    1. Nikolsky Y., Sviridov E., Yao J., Dosymbekov D., Ustyansky V., Kaznacheev V., Dezso Z., Mulvey L., Macconaill L. E., Winckler W., Serebryiskaya T., Nikolskaya T., Polyak K. (2008) Genome-wide functional synergy between amplified and mutated genes in human breast cancer. Cancer Res. 68, 9532–9540 - PubMed

Publication types

MeSH terms