. 2015 May 1;290(18):11479-90.
doi: 10.1074/jbc.M115.640581. Epub 2015 Mar 20.

Fluorescence resonance energy transfer (FRET) and proximity ligation assays reveal functionally relevant homo- and heteromeric complexes among hyaluronan synthases HAS1, HAS2, and HAS3

Affiliations

Fluorescence resonance energy transfer (FRET) and proximity ligation assays reveal functionally relevant homo- and heteromeric complexes among hyaluronan synthases HAS1, HAS2, and HAS3

Geneviève Bart et al. J Biol Chem. .

Abstract

In vertebrates, hyaluronan is produced in the plasma membrane from cytosolic UDP-sugar substrates by hyaluronan synthase 1-3 (HAS1-3) isoenzymes that transfer N-acetylglucosamine (GlcNAc) and glucuronic acid (GlcUA) in alternative positions in the growing polysaccharide chain during its simultaneous extrusion into the extracellular space. It has been shown that HAS2 immunoprecipitates contain functional HAS2 homomers and also heteromers with HAS3 (Karousou, E., Kamiryo, M., Skandalis, S. S., Ruusala, A., Asteriou, T., Passi, A., Yamashita, H., Hellman, U., Heldin, C. H., and Heldin, P. (2010) The activity of hyaluronan synthase 2 is regulated by dimerization and ubiquitination. J. Biol. Chem. 285, 23647-23654). Here we have systematically screened in live cells, potential interactions among the HAS isoenzymes using fluorescence resonance energy transfer (FRET) and flow cytometric quantification. We show that all HAS isoenzymes form homomeric and also heteromeric complexes with each other. The same complexes were detected both in Golgi apparatus and plasma membrane by using FRET microscopy and the acceptor photobleaching method. Proximity ligation assays with HAS antibodies confirmed the presence of HAS1-HAS2, HAS2-HAS2, and HAS2-HAS3 complexes between endogenously expressed HASs. C-terminal deletions revealed that the enzymes interact mainly via uncharacterized N-terminal 86-amino acid domain(s), but additional binding site(s) probably exist in their C-terminal parts. Of all the homomeric complexes HAS1 had the lowest and HAS3 the highest synthetic activity. Interestingly, HAS1 transfection reduced the synthesis of hyaluronan obtained by HAS2 and HAS3, suggesting functional cooperation between the isoenzymes. These data indicate a general tendency of HAS isoenzymes to form both homomeric and heteromeric complexes with potentially important functional consequences on hyaluronan synthesis.

Keywords: Carbohydrate Biosynthesis; Fluorescence Resonance Energy Transfer (FRET); Golgi; Hyaluronan; Hyaluronan Synthase; Protein Complex; Proximity Ligation Assay.


Figures

FIGURE 1.
FIGURE 1.
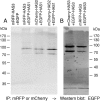
Co-immunoprecipitations of HAS isoforms. A, HAS1 co-immunoprecipitations with HAS1, HAS2, and HAS3. Beads that bind mRFP and mCherry were used to immunoprecipitate (IP) mRFP-HAS3, mCherry-HAS2, and mCherry-HAS1 from COS1 cultures co-transfected with EGFP-HAS1. B, HAS3-HAS3 co-immunoprecipitations. COS1 cells were transfected with either mCherryHAS3 and EGFP-HAS3 or mRFP-HAS3 and EGFP-HAS3 and immunoprecipitated as described in A. The presence of co-transfected EGFP-HAS1 (A) and EGFP-HAS3 (B) in the precipitates was analyzed by Western blotting using an anti-GFP-antibody. An EGFP plasmid without insert was used as a negative control (see left lane in A). The calculated molecular masses of EGFP-HAS1, EGFP-HAS2, and EGFP3 are 92, 90, and 90 kDa, respectively.
FIGURE 2.
FIGURE 2.
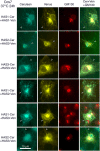
Subcellular distribution and co-localization of HAS1, HAS2, and HAS3 with C-terminal mVen and mCer tags. COS7 cells were transfected with the indicated constructs, fixed 24 h later, and stained with an antibody against the Golgi marker, GM130 (red). Arrowheads point to the cell surface.
FIGURE 3.
FIGURE 3.
Quantitation of the FRET signals by flow cytometry with mVen and mCer constructs in COS1, COS7, HeLa, and MCF7 cells. The cells expressing both mVen and mCer were analyzed by flow cytometry for FRET positive cells (% of counted) in triplicate, counting 100–300 cells in each measurement. Homomeric complexes are shown in A and heteromeric complexes in B. Means ± S.D. are shown.
FIGURE 4.
FIGURE 4.
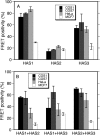
Inhibition of FRET signal by FRET-incompatible HAS constructs. The left column in each panel (A–F) shows the FRET % of the indicated HAS pair in COS7 cells. The right columns indicate the corresponding FRET % (mean ± S.D., n = 3) in the presence of competing HAS-Myc or HAS-HA constructs.
FIGURE 5.
FIGURE 5.
FRET microscopy determined by donor fluorescence increase after acceptor photobleaching. N-terminal EGFP- and mCherry-tagged HAS constructs were co-transfected in COS1 cells and imaged with confocal microscopy. A, examples of heteromeric interactions between HAS1/HAS2, HAS1/HAS3, and HAS2/HAS3. Emission of EGFP (green) before and after photobleaching of mCherry (red) is shown in photobleached regions of interest (marked by the red line). Differential interference contrast (DIC) images of the cells are shown between those of EGFP and mCherry. The rightmost panels show false color scaling of FRET efficiency. B, for each measurement, a FRET efficiency was calculated from the pre- and post-donor fluorescence intensities in the photobleached Golgi area as demonstrated by the red regions of interest in A. The average FRET efficiency of each HAS combination is expressed as the mean ± S.E. from 10–18 cells expressing both EGFP and mCherry. FRET efficiencies were calculated for all homo- and heteromeric HAS complexes (HAS1/1, HAS2/2, HAS3/3, HAS1/2, HAS1/3, and HAS2/3). EGFP-HAS1 with an empty mCherry vector is indicated by HAS1/0 and was used as a negative control. The FRET efficiencies of all HAS pairs were found to be significantly different from the FRET efficiency calculated for the negative control (HAS1/0) (p < 0.05, one-way analysis of variance with Dunnett's post hoc test).
FIGURE 6.
FIGURE 6.
Interactions detected by PLA among endogenous HAS1, HAS2, and HAS3 in mesothelial cells. Pairs of goat and rabbit antibodies against HAS proteins, detected by DNA-labeled secondary antibodies, were ligated together when the proteins were close enough to interact and amplified into a fluorescent dot. The number of dots obtained by replacing the rabbit HAS1 and HAS2 antibodies with their respective preimmune sera or by omitting one of the antibodies represents the background signal. The micrographs show an example of the HAS2/HAS2 signal and its control with preimmune serum. The columns show the means ± S.E. of 5–11 images from two experiments. ***, p < 0.0005; **, p < 0.005; and *, p < 0.01; compared with the corresponding pair with preimmune serum (Wilcoxon-Mann-Whitney rank sum test).
FIGURE 7.
FIGURE 7.
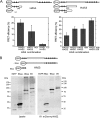
Homomeric and heteromeric interactions with truncated HAS constructs. A, the full-length and C-terminally truncated HAS1 and HAS3 constructs subjected to microscopic FRET are schematically illustrated at the top. The larger horizontal boxes represent the putative cytosolic glycosyltransferase domains, and the small boxes indicate the predicted transmembrane or membrane-associated domains. The transfected HAS combinations are indicated under the columns, and the truncated ones are marked by the number of their amino acids. Means ± S.E. of 7–15 determinations are shown. The difference in the FRET efficiency of HAS3/HAS3 versus HAS3–166 amino acids/HAS3–220 amino acids was statistically significant (p < 0.05, analysis of variance with Dunnett's post hoc test) B, full-length HAS3 and its N- and C-terminally truncated constructs, schematically illustrated at the top, were co-transfected with mCherry-HAS2. The complexes were precipitated with RFP-Trap M for red fluorescent proteins and analyzed by SDS-PAGE under reducing conditions followed by Western blotting using a GFP antibody to show the co-precipitated HAS3 constructs. Total cell lysates and the immunoprecipitates (IP) are shown in the left and right blots, respectively. The empty EGFP vector (left lanes) was used as a control (present in the lysate but not in the immunoprecipitate). The predicted molecular masses of intact EGFP-HAS3, −86aa EGFP-HAS3, 86aa EGFP-HAS3, and EGFP are 90, 80, 37, and 27 kDa, respectively.
FIGURE 8.
FIGURE 8.
Hyaluronan synthesis by the different HAS complexes. A, HAS-mCer and HAS-mVen were transfected to COS7 cells and cultivated for 24 h after which the media were collected for the determination of hyaluronan levels. The cells were detached and analyzed for fluorescence by flow cytometry to allow calculation of the normalized relative activities of the various HAS complexes, as described under “Experimental Procedures.” Each column represents the corrected values (mean + S.D.) from triplicate samples. HAS1 activity = 1 was used as a reference value. B, C8161 cells were stably transduced with the EYFP-HAS2 gene, the expression of which could be induced by doxycyclin. The cells were transiently transfected with mCer or mVen, with or without EYFP-HAS2 induction, using 0.25 μg/ml doxycyclin. The hyaluronan values were normalized to the mCer fluorescence of the cultures. The EYFP, mCer, and mVen fluorescence ratios in each of the pairs ranged between 0.70 and 1.15, suggesting roughly equal expressions of the constructs. The means ± S.E. of three separate experiments are shown. The decrease in the hyaluronan synthesis of HAS2 and HAS3 by co-transfection of HAS1 was statistically significant: p < 0.05 and p < 0.001, respectively, using repeated measures analysis of variance with Bonferroni corrections.

References

    1. Laurent T. C., Laurent U. B., Fraser J. R. (1996) The structure and function of hyaluronan: an overview. Immunol. Cell Biol. 74, A1–A7 - PubMed
    1. Tammi M. I., Day A. J., Turley E. A. (2002) Hyaluronan and homeostasis: a balancing act. J. Biol. Chem. 277, 4581–4584 - PubMed
    1. Bakkers J., Kramer C., Pothof J., Quaedvlieg N. E., Spaink H. P., Hammerschmidt M. (2004) Has2 is required upstream of Rac1 to govern dorsal migration of lateral cells during zebrafish gastrulation. Development 131, 525–537 - PubMed
    1. Camenisch T. D., Schroeder J. A., Bradley J., Klewer S. E., McDonald J. A. (2002) Heart-valve mesenchyme formation is dependent on hyaluronan-augmented activation of ErbB2-ErbB3 receptors. Nat. Med. 8, 850–855 - PubMed
    1. Tolg C., Hamilton S. R., Zalinska E., McCulloch L., Amin R., Akentieva N., Winnik F., Savani R., Bagli D. J., Luyt L. G., Cowman M. K., McCarthy J. B., Turley E. A. (2012) A RHAMM mimetic peptide blocks hyaluronan signaling and reduces inflammation and fibrogenesis in excisional skin wounds. Am. J. Pathol. 181, 1250–1270 - PMC - PubMed

Publication types