. 2015 Apr 20;6(11):8760-76.
doi: 10.18632/oncotarget.3315.

TRPM7 maintains progenitor-like features of neuroblastoma cells: implications for metastasis formation

Affiliations

TRPM7 maintains progenitor-like features of neuroblastoma cells: implications for metastasis formation

Jeroen Middelbeek et al. Oncotarget. .

Abstract

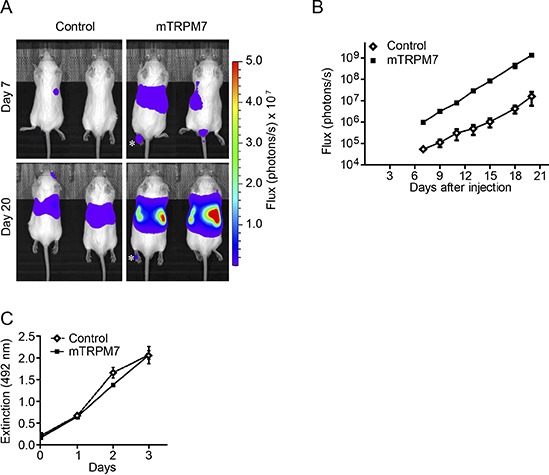
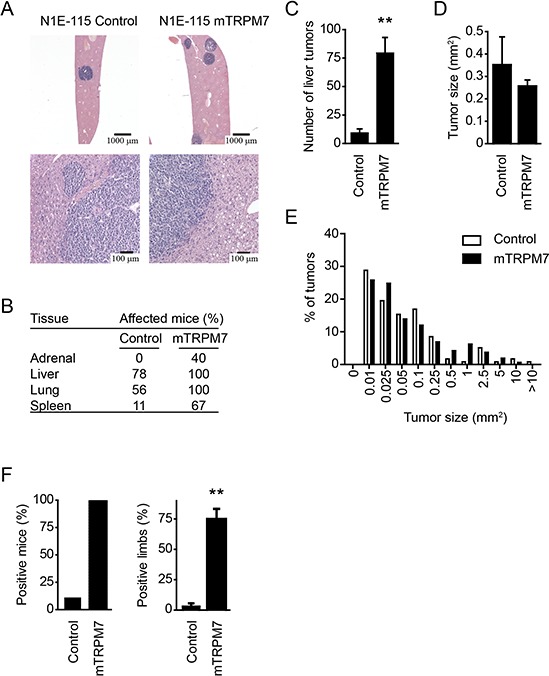
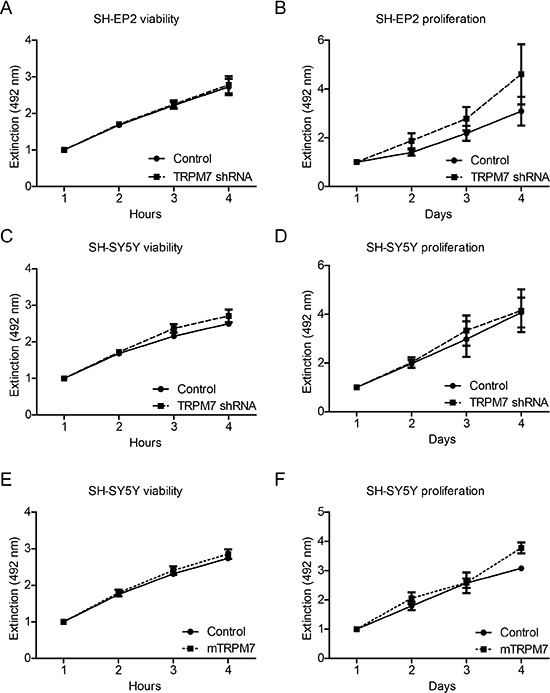
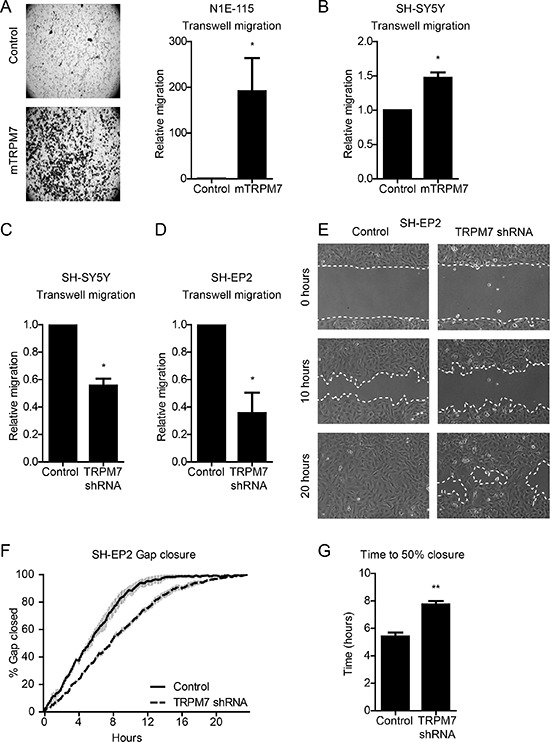
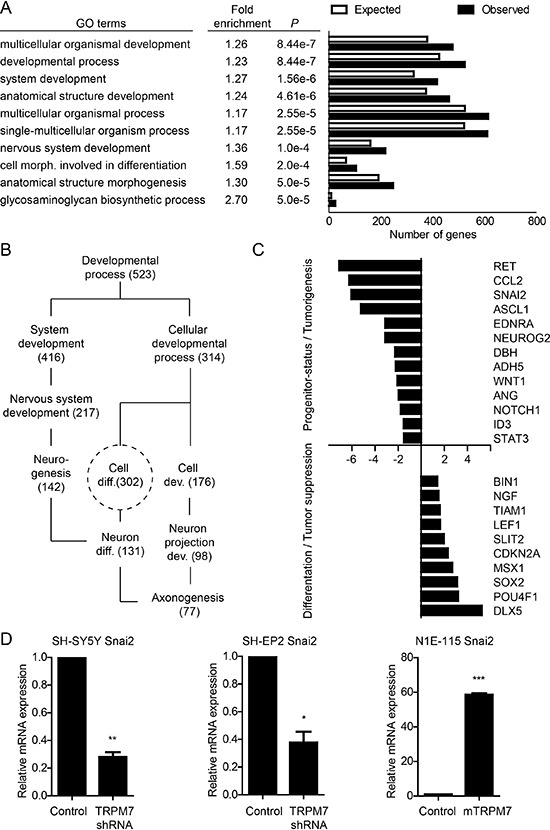
Neuroblastoma is an embryonal tumor derived from poorly differentiated neural crest cells. Current research is aimed at identifying the molecular mechanisms that maintain the progenitor state of neuroblastoma cells and to develop novel therapeutic strategies that induce neuroblastoma cell differentiation. Mechanisms controlling neural crest development are typically dysregulated during neuroblastoma progression, and provide an appealing starting point for drug target discovery. Transcriptional programs involved in neural crest development act as a context dependent gene regulatory network. In addition to BMP, Wnt and Notch signaling, activation of developmental gene expression programs depends on the physical characteristics of the tissue microenvironment. TRPM7, a mechanically regulated TRP channel with kinase activity, was previously found essential for embryogenesis and the maintenance of undifferentiated neural crest progenitors. Hence, we hypothesized that TRPM7 may preserve progenitor-like, metastatic features of neuroblastoma cells. Using multiple neuroblastoma cell models, we demonstrate that TRPM7 expression closely associates with the migratory and metastatic properties of neuroblastoma cells in vitro and in vivo. Moreover, microarray-based expression profiling on control and TRPM7 shRNA transduced neuroblastoma cells indicates that TRPM7 controls a developmental transcriptional program involving the transcription factor SNAI2. Overall, our data indicate that TRPM7 contributes to neuroblastoma progression by maintaining progenitor-like features.

Keywords: differentiation; metastasis; neuroblastoma; snai2; trpm7.


Conflict of interest statement

Conflict of interests

The authors declare no conflict of interests.

Figures

Figure 1
Figure 1. TRPM7 increases the metastatic potential of N1E-115 cells
(A) Representative bioluminescent images of mice, 7 and 20 days after intravenous injections with N1E-115 control or mTRPM7 overexpressing cells (n = 9 mice in each group). Photon fluxes are set to the same scale (photons / s). Asterix indicates an example of bioluminescence observed in a limb. (B) Quantification of bioluminescence in the abdominal region between day 7 and day 20 post-injection. Data are mean ± SEM of n = 9 mice per group. Data presented are from 1 out of 2 independent experiments that show highly reproducible results. (C) Quantification of cell proliferation, determined by MTS assays. Data are mean extinction at 492 nm ± SEM of n = 3 experiments.
Figure 2
Figure 2. TRPM7 promotes metastatic spread to liver and bone marrow
(A) Representative H&E staining on liver tissue, collected 20 days after injection with N1E-115 cells. Prominent tumors in the liver indicate that both N1E-115 control and mTRPM7 overexpressing cells metastasize to the liver. (B) Histopathological analysis of mouse tissue sections, collected 20 days after injection with either N1E-115 control or mTRPM7 overexpressing cells. Mouse tissues were scored for the presence of tumor cells. Adrenal glands of 5 mice were scored for presence of tumor cells, whereas 9 mice were dissected for other tissues. (C) Quantification of the number of liver tumors per mouse, measured in resected liver tissue from mice injected with N1E-115 control or mTRPM7 overexpressing cells. Data are mean ± SEM of n = 9 mice in each group. **p < 0.01, two-tailed unpaired t-test with Welch correction. (D) Quantification of mean liver tumor size in mice injected with N1E-115 control and mTRPM7 overexpressing cells. Data are mean ± SEM of n = 9 mice in each group. (E) Size distribution of tumors in liver sections emphasizes similar growth rates for both cell lines. (F) Percentage of mice (left panel) and limbs (right panel) with bone marrow metastases. Data are mean ± SEM of n = 9 mice in each group. **p < 0.01, two-tailed unpaired t-test with Welch correction.
Figure 3
Figure 3. Manipulation of TRPM7 expression does not affect neuroblastoma cell viability and proliferation
Quantification of cell viability and proliferation, determined by MTS assays. Viability was assessed over 4 hours, proliferation was assessed over 4 days. Data represents normalized mean extinction at 492 nm mean ± SEM of n > 2 experiments performed in triplo. (A–D) Effects of TRPM7 shRNA on viability and proliferation of SH-EP2 cells and SH-SH-5Y human neuroblastoma cells. (E & F) Effects of mTRPM7 overexpression on viability and proliferation of SH-SY5Y human neuroblastoma cells.
Figure 4
Figure 4. TRPM7 drives mouse and human neuroblastoma cell migration
(A) & (B) Transwell migration of N1E-115 (n = 6) and SH-SY5Y (n = 3) control and mTRPM7 overexpressing cells. Equal numbers of cells were allowed to migrate towards a serum gradient for 48 hours. Data are normalized to control and represent mean ± SEM of n > 3 independent experiments performed in duplicate. (C) & (D) Transwell migration of SH-SH5Y and SH-EP2 control and TRPM7 shRNA cells. Equal numbers of SH-SY5Y and SH-EP2 cells were allowed to migrate towards a serum gradient for 48 and 24 hours respectively. Data are normalized to control and represent mean ± SEM of n = 3 independent experiments performed in duplicate. (E) Representative images of gap closure by SH-EP2 control and TRPM7 shRNA cells at time points 0, 10 and 20 hours. (F) Gap closure over time, presented as percentage of gap size at time point 0 hours. (G) Quantification of time to 50% gap closure. Data in (F) and (G) represent mean from n = 3 independent experiments, each performed in duplicate. *p < 0.05, **p < 0.01, two-tailed unpaired t-test.
Figure 5
Figure 5. TRPM7 controls progenitor-like features of neuroblastic neuroblastoma cells at the gene expression level
(A) TRPM7 controls developmental gene expression programs. GO-term analysis was performed on genes that were differentially expressed (p < 0.05) in SH-SY5Y TRPM7 shRNA cells, when compared to SH-SY5Y control cells. Presented are the 10 most significantly enriched (P) GO-terms within the subroot ‘Biological Process’. Fold enrichment is the ratio between observed and expected genes within a category. Number of expected genes is based on the number of protein encoding genes within a category. (B) TRPM7 shRNA affects genes that control neuronal differentiation. Simplified representation of GO-term relationships involved in neuronal differentiation, and the number of genes observed per category. (C) TRPM7 shRNA impairs progenitor-status and tumorigenicity of neuroblastic SH-SY5Y neuroblastoma cells. Selection of differentially regulated genes within the ‘Cell Differentiation’ category that are known to control neural crest formation, delamination and differentiation, and neuroblastoma progression (Table 1). X-axis represents fold difference in normalized expression levels between control and TRPM7 shRNA SH-SY5Y cells. (D) TRPM7 drives expression of SNAI2 transcription factor in human and mouse neuroblastoma cell lines. SNAI2 expression levels were determined by quantitative RT-PCR in SH-SY5Y and SH-EP2 control and TRPM7 shRNA cells. Additionally, SNAI2 expression levels were quantified in N1E-115 mouse neuroblastoma control and TRPM7 overexpressing cells. Data represents mean expression levels ± SEM (n = 3) that are normalized to GAPDH housekeeping gene expression. SNAI2 expression in control cells is set to 1. *p < 0.05, **p < 0.01, ***p < 0.001.

References

    1. Maris JM. Recent advances in neuroblastoma. N Engl J Med. 2010;362:2202–11. Epub 2010/06/19. - PMC - PubMed
    1. Morgenstern DA, Baruchel S, Irwin MS. Current and future strategies for relapsed neuroblastoma: challenges on the road to precision therapy. J Pediatr Hematol Oncol. 2013;35:337–47. Epub 2013/05/25. - PubMed
    1. Cheung NK, Dyer MA. Neuroblastoma: developmental biology, cancer genomics and immunotherapy. Nat Rev Cancer. 2013;13:397–411. Epub 2013/05/25. - PMC - PubMed
    1. Jiang M, Stanke J, Lahti JM. The connections between neural crest development and neuroblastoma. Current topics in developmental biology. 2011;94:77–127. Epub 2011/02/08. - PMC - PubMed
    1. Mohlin SA, Wigerup C, Pahlman S. Neuroblastoma aggressiveness in relation to sympathetic neuronal differentiation stage. Seminars in cancer biology. 2011;21:276–82. Epub 2011/09/29. - PubMed

Publication types

MeSH terms