

Multimodal neuroimaging based classification of autism spectrum disorder using anatomical, neurochemical, and white matter correlates
- PMID: 25797658
- PMCID: PMC4782775
- DOI: 10.1016/j.cortex.2015.02.008
Multimodal neuroimaging based classification of autism spectrum disorder using anatomical, neurochemical, and white matter correlates
Abstract
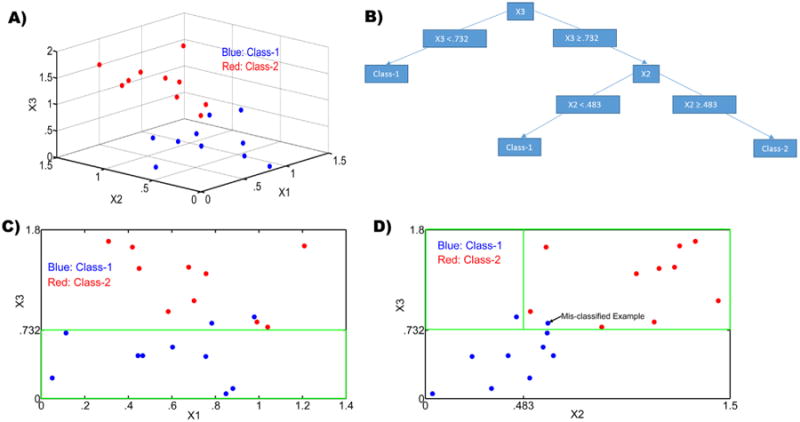
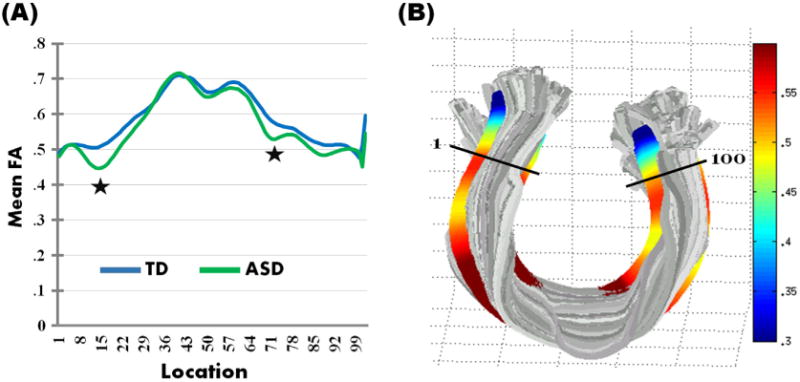
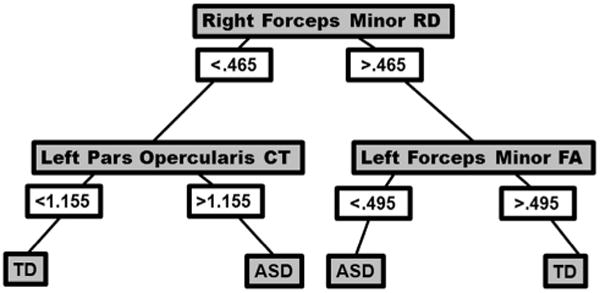
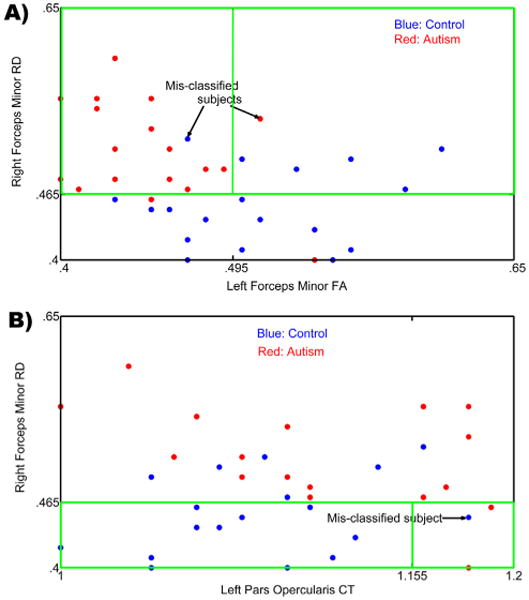
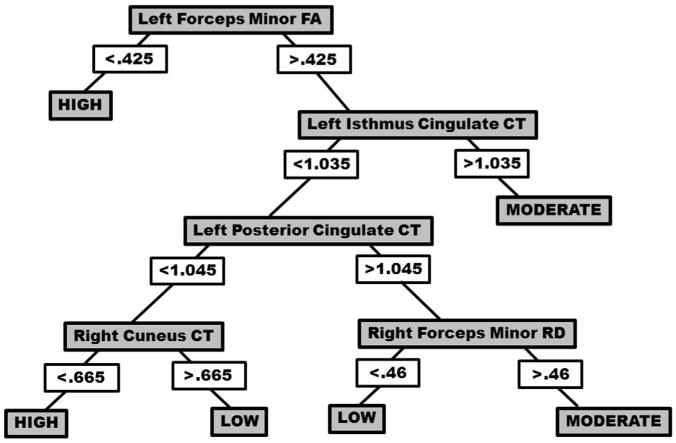
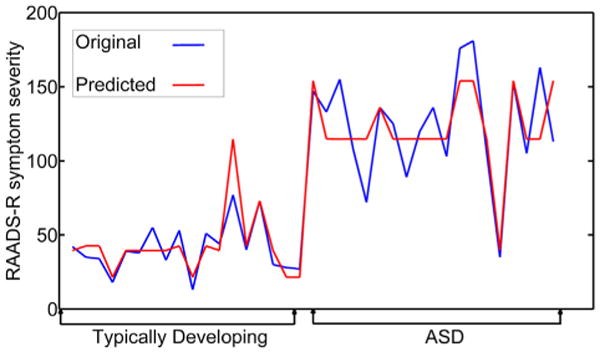
Neuroimaging techniques, such as fMRI, structural MRI, diffusion tensor imaging (DTI), and proton magnetic resonance spectroscopy (1H-MRS) have uncovered evidence for widespread functional and anatomical brain abnormalities in autism spectrum disorder (ASD) suggesting it to be a system-wide neural systems disorder. Nevertheless, most previous studies have focused on examining one index of neuropathology through a single neuroimaging modality, and seldom using multiple modalities to examine the same cohort of individuals. The current study aims to bring together multiple brain imaging modalities (structural MRI, DTI, and 1H-MRS) to investigate the neural architecture in the same set of individuals (19 high-functioning adults with ASD and 18 typically developing (TD) peers). Morphometry analysis revealed increased cortical thickness in ASD participants, relative to typical controls, across the left cingulate, left pars opercularis of the inferior frontal gyrus, left inferior temporal cortex, and right precuneus, and reduced cortical thickness in right cuneus and right precentral gyrus. ASD adults also had reduced fractional anisotropy (FA) and increased radial diffusivity (RD) for two clusters on the forceps minor of the corpus callosum, revealed by DTI analyses. 1H-MRS results showed a reduction in the N-acetylaspartate/Creatine ratio in dorsal anterior cingulate cortex (dACC) in ASD participants. A decision tree classification analysis across the three modalities resulted in classification accuracy of 91.9% with FA, RD, and cortical thickness as key predictors. Examining the same cohort of adults with ASD and their TD peers, this study found alterations in cortical thickness, white matter (WM) connectivity, and neurochemical concentration in ASD. These findings underscore the potential for multimodal imaging to better inform on the neural characteristics most relevant to the disorder.
Keywords: Autism; Classification; DTI; MRI; Multimodal neuroimaging; Spectroscopy.
Copyright © 2015 Elsevier Ltd. All rights reserved.
Figures
References
-
- Adolphs R. The neurobiology of social cognition. Current Opinion in Neurobiology. 2001;11(2):231–239. - PubMed
-
- Adolphs R. The social brain: neural basis of social knowledge. Annual Review of Psychology. 2009;60:693–716. http://dx.doi.org/10.1146/annurev.psych.60.110707.163514. - DOI - PMC - PubMed
-
- Akshoomoff N, Lord C, Lincoln AJ, Courchesne RY, Carper RA, Townsend J, et al. Outcome classification of preschool children with autism spectrum disorders using MRI brain measures. Journal of the American Academy of Child & Adolescent Psychiatry. 2004;43(3):349–357. - PubMed
-
- Alexander AL, Lee JE, Lazar M, Boudos R, DuBray MB, Oakes TR, et al. Diffusion tensor imaging of the corpus callosum in Autism. NeuroImage. 2007;34(1):61–73. - PubMed
-
- Amaral DG, Schumann CM, Nordahl CW. Neuroanatomy of autism. Trends in Neurosciences. 2008;31(3):137–145. - PubMed
Publication types
MeSH terms
Substances
Grants and funding
LinkOut - more resources
Full Text Sources
Other Literature Sources
Medical
Miscellaneous
