

Multiple brain networks contribute to the acquisition of bias in perceptual decision-making
- PMID: 25798082
- PMCID: PMC4350407
- DOI: 10.3389/fnins.2015.00063
Multiple brain networks contribute to the acquisition of bias in perceptual decision-making
Abstract
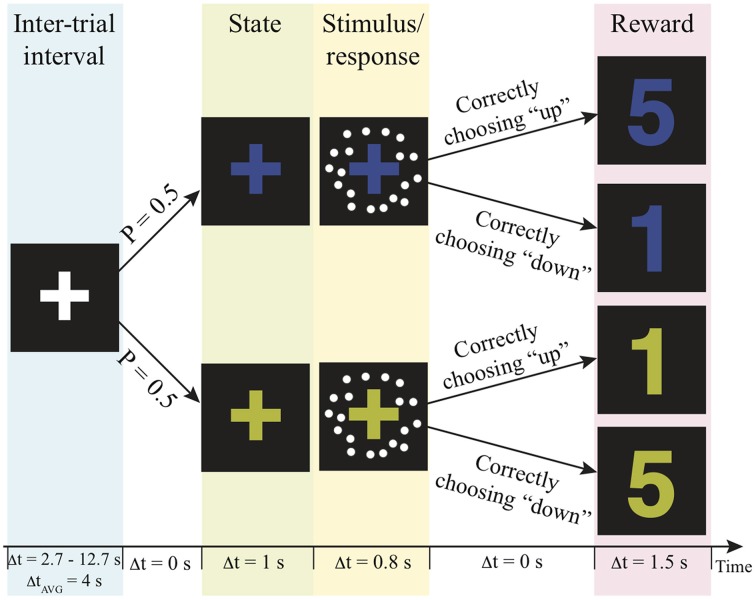
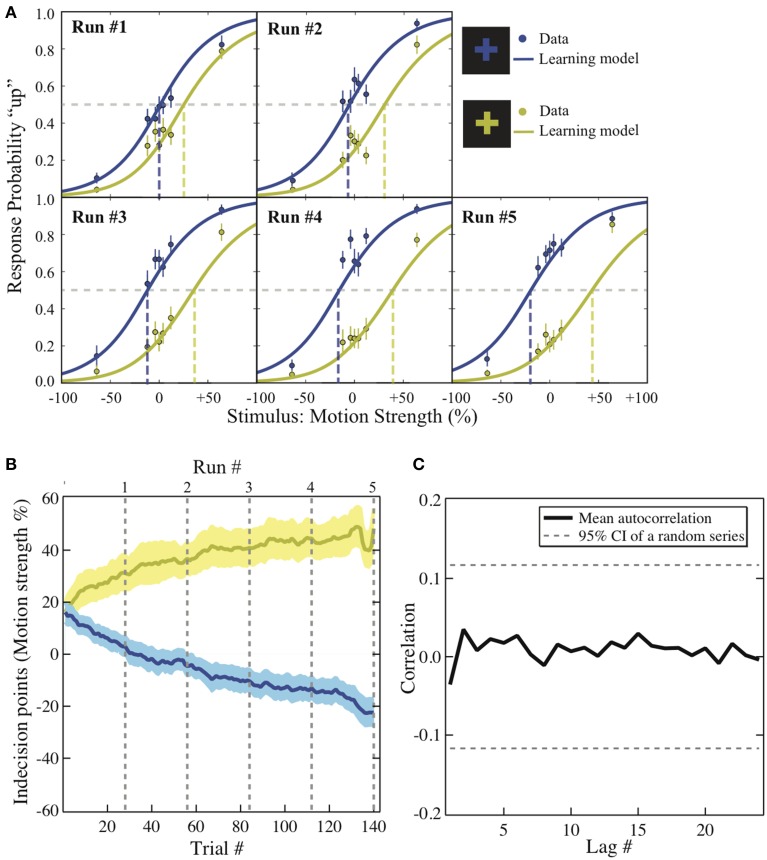
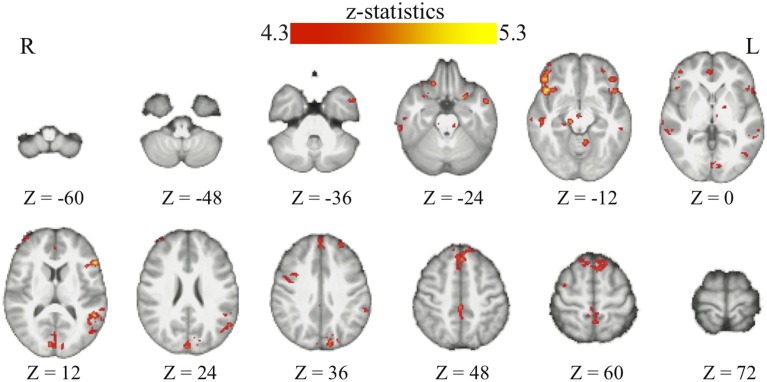
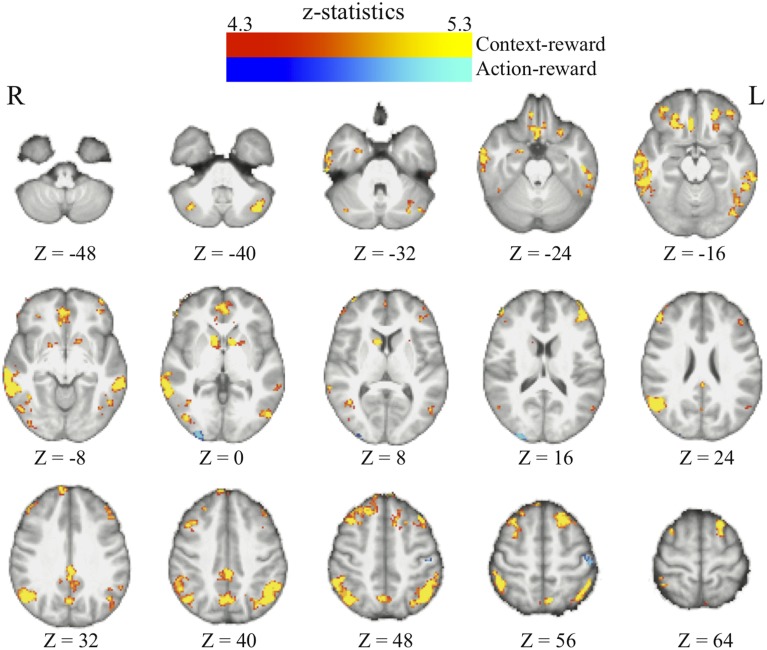
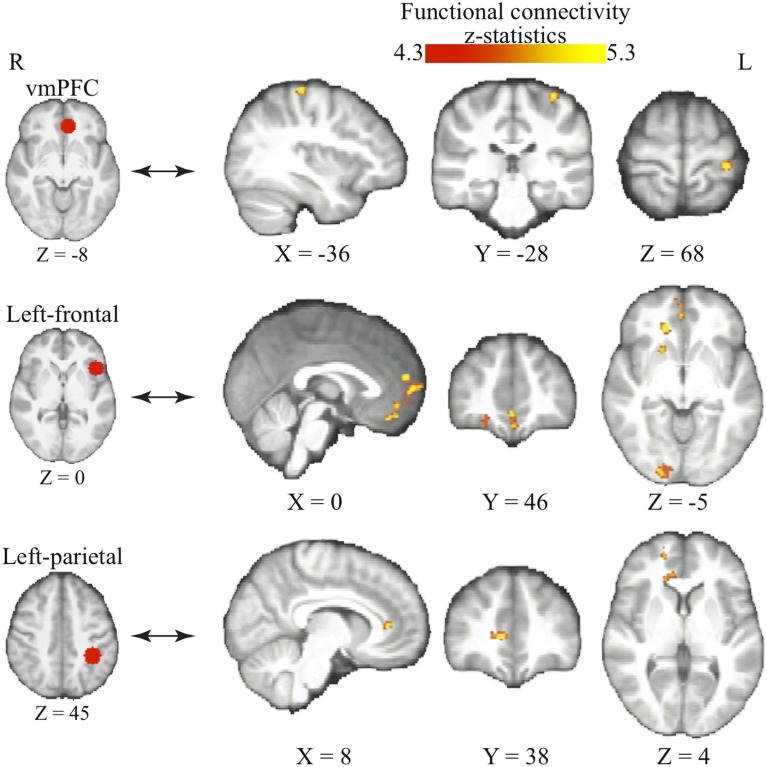
Bias occurs in perceptual decisions when the reward associated with a particular response dominates the sensory evidence in support of a choice. However, it remains unclear how this bias is acquired and once acquired, how it influences perceptual decision processes in the brain. We addressed these questions using model-based neuroimaging in a motion discrimination paradigm where contextual cues suggested which one of two options would receive higher rewards on each trial. We found that participants gradually learned to choose the higher-rewarded option in each context when making a perceptual decision. The amount of bias on each trial was fit well by a reinforcement-learning model that estimated the subjective value of each option within the current context. The brain mechanisms underlying this bias acquisition process were similar to those observed in reward-based decision tasks: prediction errors correlated with the fMRI signals in ventral striatum, dlPFC, and parietal cortex, whereas the amount of acquired bias correlated with activity in ventromedial prefrontal (vmPFC), dorsolateral frontal (dlPFC), and parietal cortices. Moreover, psychophysiological interaction analysis revealed that as bias increased, functional connectivity increased within multiple brain networks (dlPFC-vmPFC-visual, vmPFC-motor, and parietal-anterior-cingulate), suggesting that multiple mechanisms contribute to bias in perceptual decisions through integration of value processing with action, sensory, and control systems. These provide a novel link between the neural mechanisms underlying perceptual and economic decision-making.
Keywords: decision-making; fMRI; motion discrimination; reinforcement learning; reward.
Figures
Similar articles
-
Ventromedial Prefrontal Cortex Damage Is Associated with Decreased Ventral Striatum Volume and Response to Reward.J Neurosci. 2016 May 4;36(18):5047-54. doi: 10.1523/JNEUROSCI.4236-15.2016. J Neurosci. 2016. PMID: 27147657 Free PMC article.
-
Congruence of Inherent and Acquired Values Facilitates Reward-Based Decision-Making.J Neurosci. 2016 May 4;36(18):5003-12. doi: 10.1523/JNEUROSCI.3084-15.2016. J Neurosci. 2016. PMID: 27147653 Free PMC article.
-
From anticipation to action, the role of dopamine in perceptual decision making: an fMRI-tyrosine depletion study.J Neurophysiol. 2012 Jul;108(2):501-12. doi: 10.1152/jn.00592.2011. Epub 2012 May 2. J Neurophysiol. 2012. PMID: 22552189
-
Reward-dependent learning in neuronal networks for planning and decision making.Prog Brain Res. 2000;126:217-29. doi: 10.1016/S0079-6123(00)26016-0. Prog Brain Res. 2000. PMID: 11105649 Review.
-
The alcoholic brain: neural bases of impaired reward-based decision-making in alcohol use disorders.Neurol Sci. 2018 Mar;39(3):423-435. doi: 10.1007/s10072-017-3205-1. Epub 2017 Nov 29. Neurol Sci. 2018. PMID: 29188399 Review.
Cited by
-
Context-Sensitive Computational Mechanisms of Decision Making.J Exp Neurosci. 2018 Nov 19;12:1179069518809057. doi: 10.1177/1179069518809057. eCollection 2018. J Exp Neurosci. 2018. PMID: 30479488 Free PMC article. Review.
-
Frontal eye field and caudate neurons make different contributions to reward-biased perceptual decisions.Elife. 2020 Nov 27;9:e60535. doi: 10.7554/eLife.60535. Elife. 2020. PMID: 33245044 Free PMC article.
-
Cross-Hemispheric Complementary Prefrontal Mechanisms during Task Switching under Perceptual Uncertainty.J Neurosci. 2021 Mar 10;41(10):2197-2213. doi: 10.1523/JNEUROSCI.2096-20.2021. Epub 2021 Jan 19. J Neurosci. 2021. PMID: 33468569 Free PMC article.
-
Visual perceptual training reconfigures post-task resting-state functional connectivity with a feature-representation region.PLoS One. 2018 May 9;13(5):e0196866. doi: 10.1371/journal.pone.0196866. eCollection 2018. PLoS One. 2018. PMID: 29742133 Free PMC article.
-
Boosts in brain signal variability track liberal shifts in decision bias.Elife. 2020 Aug 3;9:e54201. doi: 10.7554/eLife.54201. Elife. 2020. PMID: 32744502 Free PMC article.
References
-
- Akaike H. (1974). A new look at the statistical model identification. IEEE Trans. Automat. Contr. 19, 716–723 10.1109/TAC.1974.1100705 - DOI
-
- Box G., Jenkins G. M., Reinsel G. (1994). Time Series Analysis: Forecasting and Control, 3rd Edn. Englewood Cliffs, NJ: Wiley.
Grants and funding
LinkOut - more resources
Full Text Sources
Other Literature Sources