Review
. 2015 Mar 5:3:23.
doi: 10.3389/fbioe.2015.00023. eCollection 2015.

Analytical methods in untargeted metabolomics: state of the art in 2015

Affiliations
Review

Analytical methods in untargeted metabolomics: state of the art in 2015

Arnald Alonso et al. Front Bioeng Biotechnol. .

Abstract

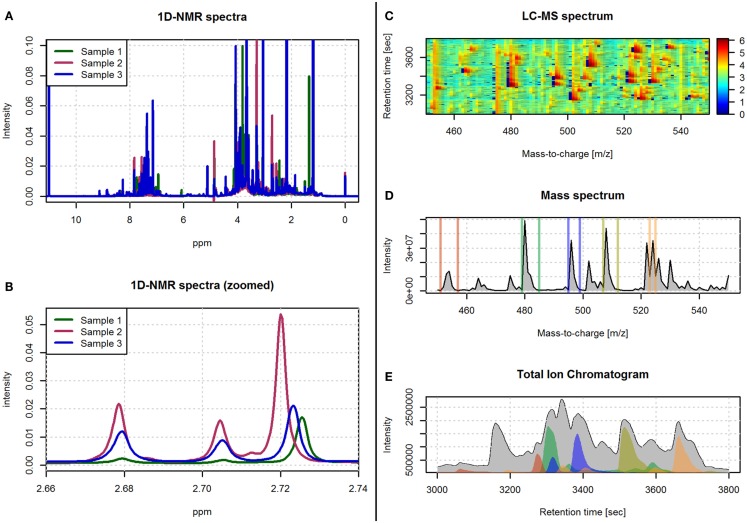
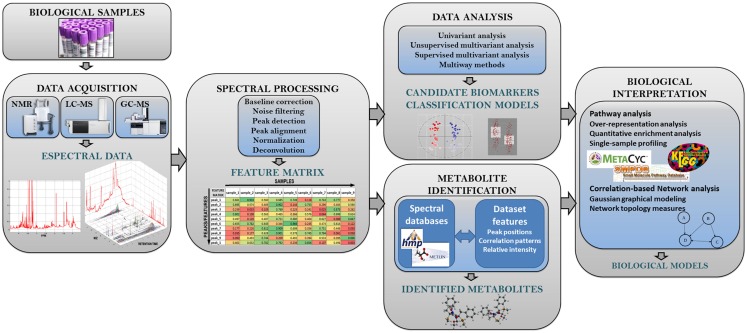
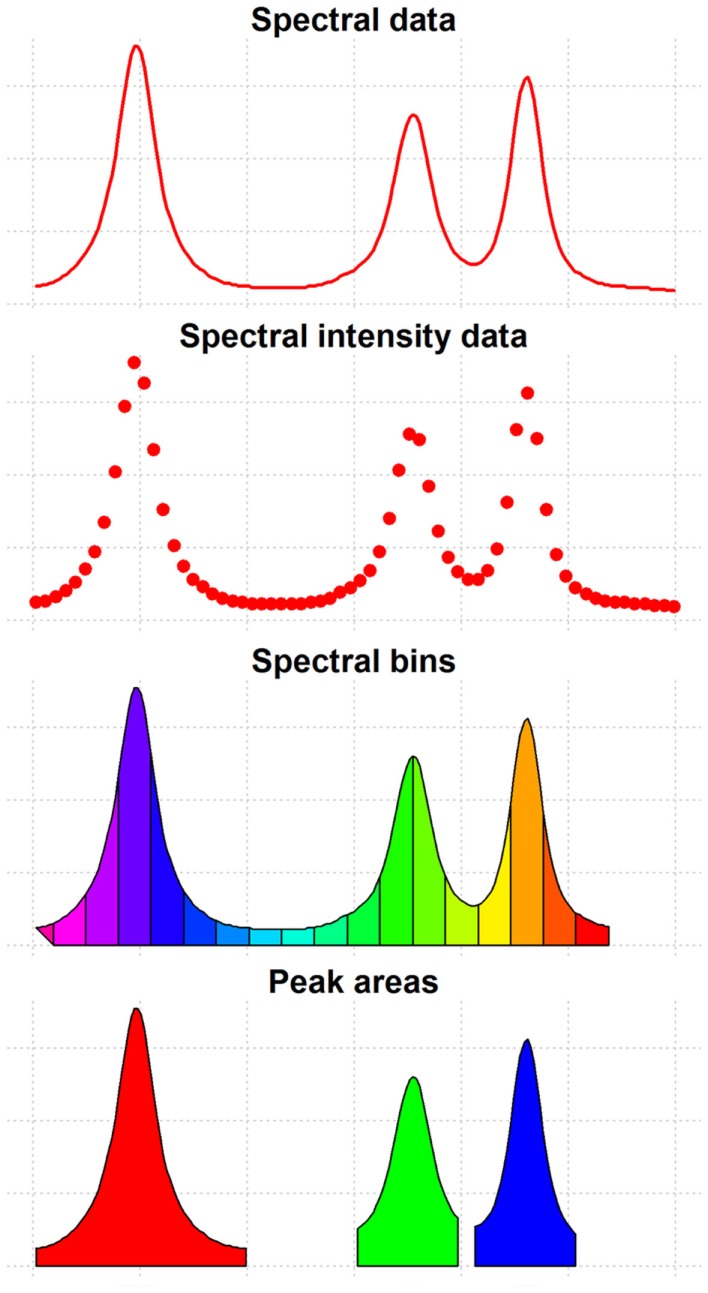
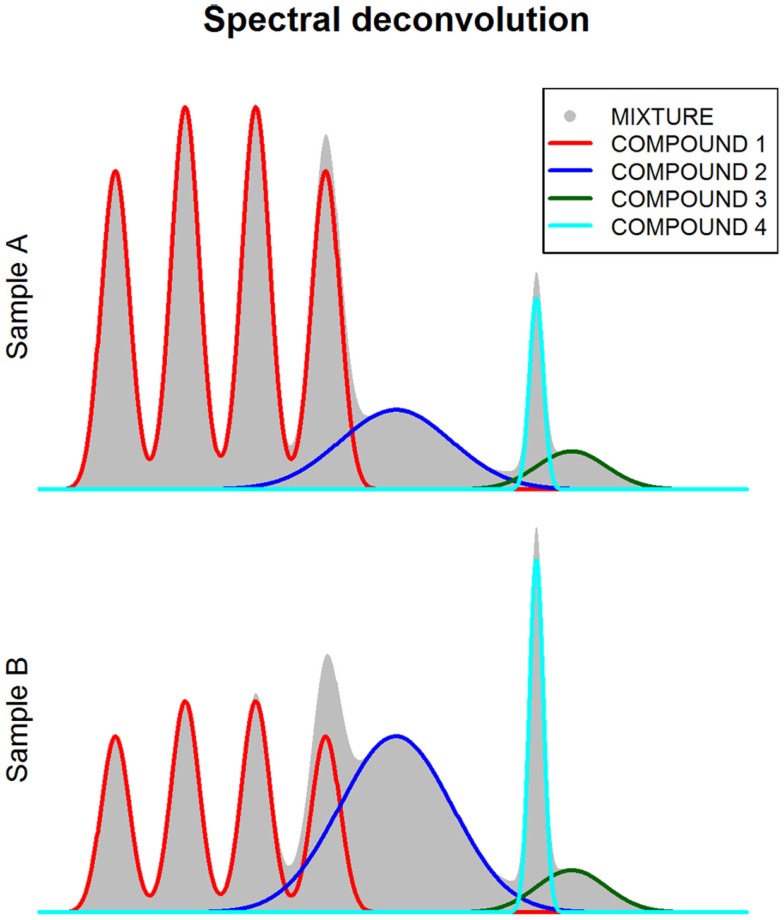
Metabolomics comprises the methods and techniques that are used to measure the small molecule composition of biofluids and tissues, and is actually one of the most rapidly evolving research fields. The determination of the metabolomic profile - the metabolome - has multiple applications in many biological sciences, including the developing of new diagnostic tools in medicine. Recent technological advances in nuclear magnetic resonance and mass spectrometry are significantly improving our capacity to obtain more data from each biological sample. Consequently, there is a need for fast and accurate statistical and bioinformatic tools that can deal with the complexity and volume of the data generated in metabolomic studies. In this review, we provide an update of the most commonly used analytical methods in metabolomics, starting from raw data processing and ending with pathway analysis and biomarker identification. Finally, the integration of metabolomic profiles with molecular data from other high-throughput biotechnologies is also reviewed.

Keywords: data analysis; integration; mass spectrometry; metabolomics; nuclear magnetic resonance; pathway analysis; spectral processing; untargeted.


Figures

Figure 1
Figure 1
Examples of spectra obtained with 1H-NMR and LC-MS technologies. (A) An example of three spectra obtained with 1D 1H-NMR. (B) A zoomed view of the spectra in (A) in the 2.66–2.74 ppm range. (C) An example of a LC-MS spectrum with color-coded intensity and referred by the m/z and retention time axes. (D) The sum of the LC-MS spectrum across the m/z axis. (E) The total ion chromatogram (i.e., sum of the LC-MS spectrum across the retention time axis). The colored regions in (E) correspond to the sum of the LC-MS spectrum limited to the m/z ranges depicted with the same color in (D).
Figure 2
Figure 2
Analysis workflow in untargeted metabolomic studies. This figure shows the different steps of the metabolomic analysis pipeline.
Figure 3
Figure 3
Features of spectral data. This figure shows the different types of features that can be extracted from spectral data and used for data analysis.
Figure 4
Figure 4
Spectral deconvolution. This figure shows how spectra (gray shaded area) can be decomposed (i.e., deconvoluted) in multiple components corresponding to different metabolite compounds.

References

    1. Adjaye J., Huntriss J., Herwig R., Benkahla A., Brink T. C., Wierling C., et al. (2005). Primary differentiation in the human blastocyst: comparative molecular portraits of inner cell mass and trophectoderm cells. Stem Cells 23, 1514–1525.10.1634/stemcells.2005-0113 - DOI - PubMed
    1. Aittokallio T., Schwikowski B. (2006). Graph-based methods for analysing networks in cell biology. Brief. Bioinformatics 7, 243–255.10.1093/bib/bbl022 - DOI - PubMed
    1. Akiyama K., Chikayama E., Yuasa H., Shimada Y., Tohge T., Shinozaki K., et al. (2008). PRIMe: a web site that assembles tools for metabolomics and transcriptomics. In silico Biol. 8, 339–345. - PubMed
    1. Allison D. B., Thiel B., Jean P. St., Elston R. C., Infante M. C., Schork N. J. (1998). Multiple phenotype modeling in gene-mapping studies of quantitative traits: power advantages. Am. J. Hum. Genet. 63, 1190–1201.10.1086/302038 - DOI - PMC - PubMed
    1. Alonso A., Julià A., Beltran A., Vinaixa M., Díaz M., Ibañez L., et al. (2011). AStream: an R package for annotating LC/MS metabolomic data. Bioinformatics 27, 1339–1340.10.1093/bioinformatics/btr138 - DOI - PubMed