. 2015 Apr;125(4):1591-602.
doi: 10.1172/JCI78239. Epub 2015 Mar 23.

Compensatory glutamine metabolism promotes glioblastoma resistance to mTOR inhibitor treatment

Compensatory glutamine metabolism promotes glioblastoma resistance to mTOR inhibitor treatment

Kazuhiro Tanaka et al. J Clin Invest. 2015 Apr.

Abstract

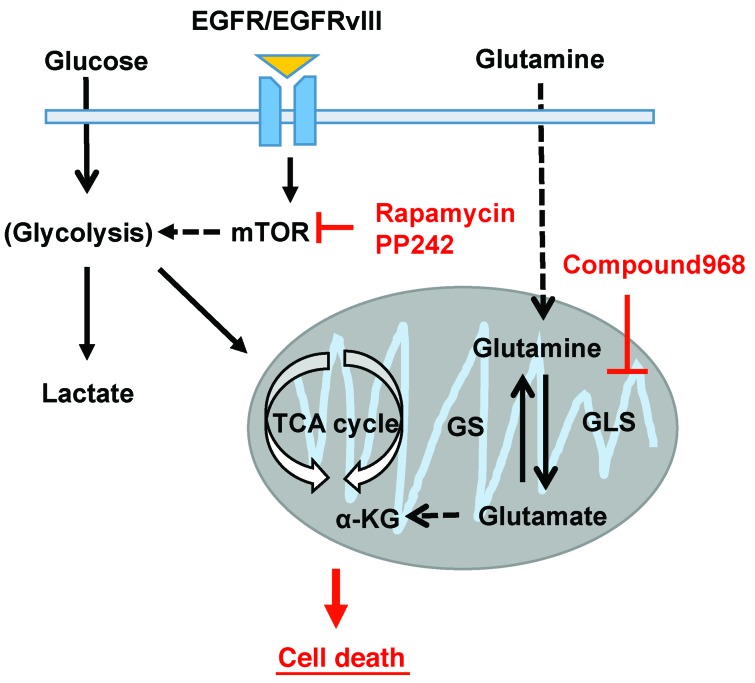
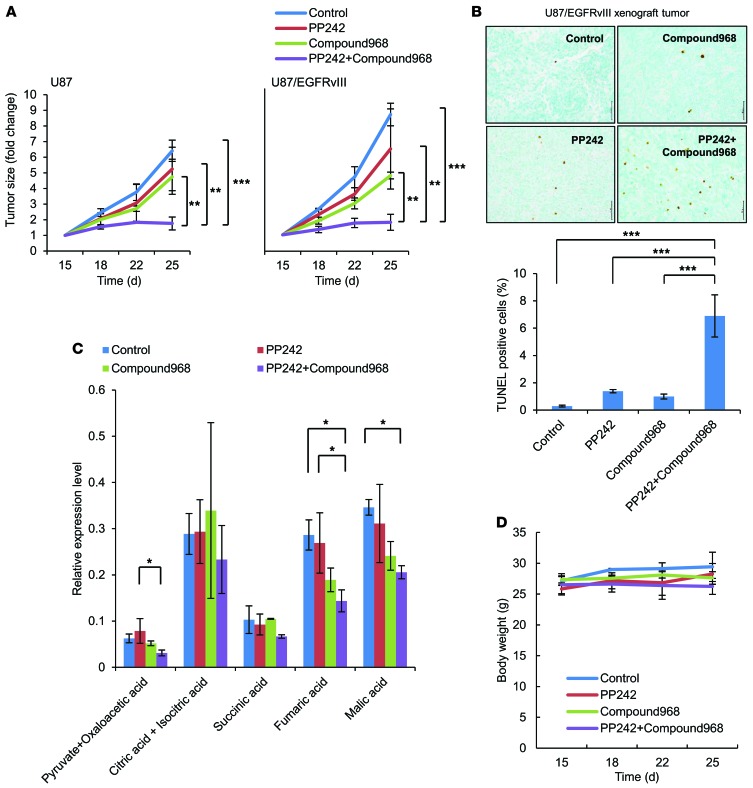
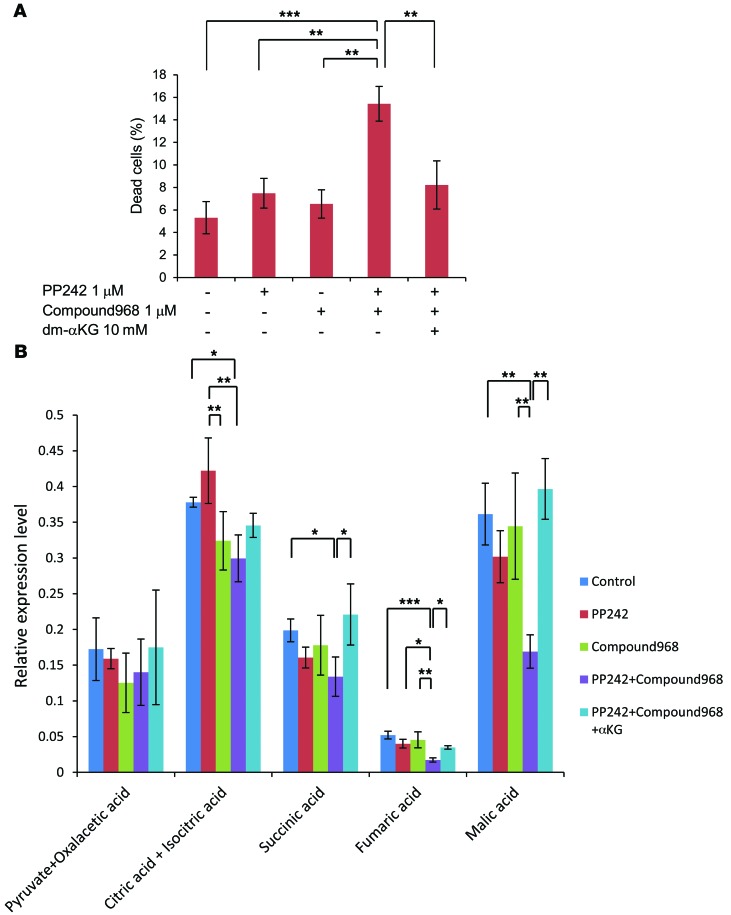
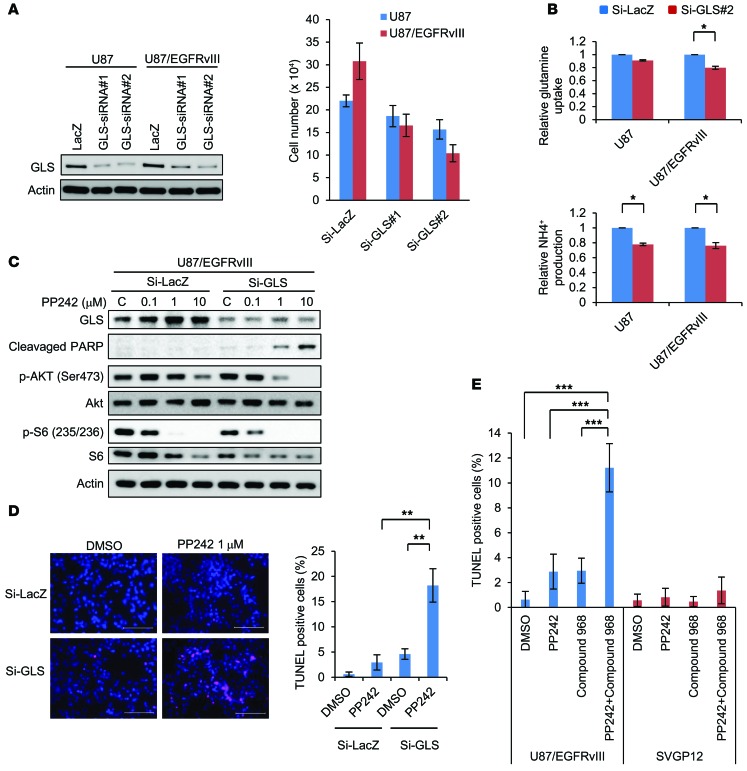
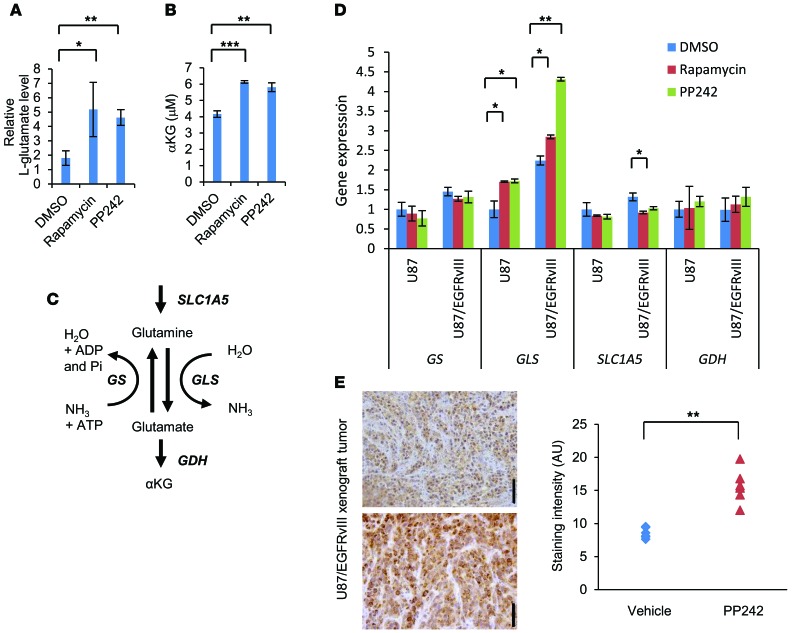
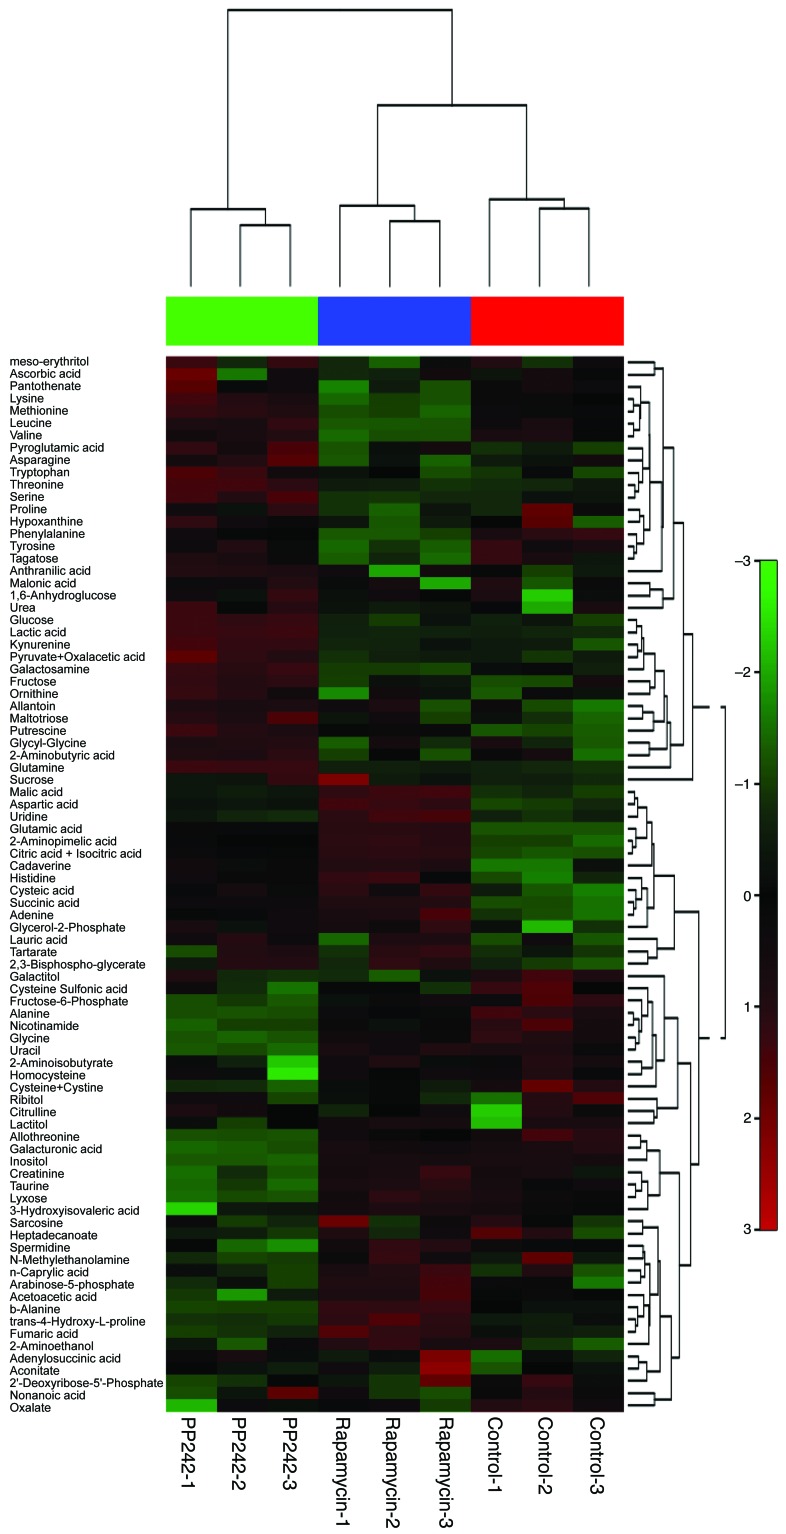
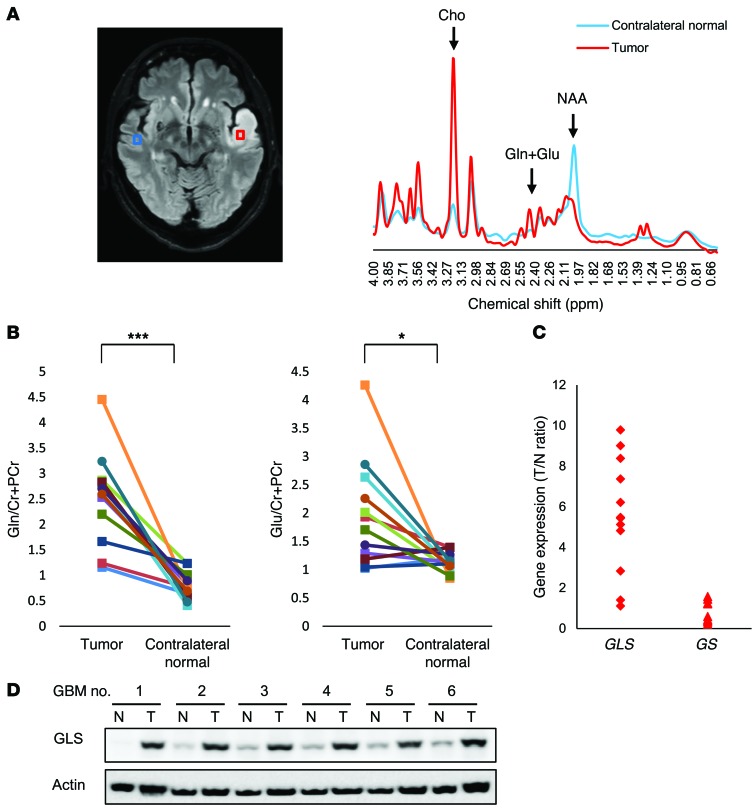
The mechanistic target of rapamycin (mTOR) is hyperactivated in many types of cancer, rendering it a compelling drug target; however, the impact of mTOR inhibition on metabolic reprogramming in cancer is incompletely understood. Here, by integrating metabolic and functional studies in glioblastoma multiforme (GBM) cell lines, preclinical models, and clinical samples, we demonstrate that the compensatory upregulation of glutamine metabolism promotes resistance to mTOR kinase inhibitors. Metabolomic studies in GBM cells revealed that glutaminase (GLS) and glutamate levels are elevated following mTOR kinase inhibitor treatment. Moreover, these mTOR inhibitor-dependent metabolic alterations were confirmed in a GBM xenograft model. Expression of GLS following mTOR inhibitor treatment promoted GBM survival in an α-ketoglutarate-dependent (αKG-dependent) manner. Combined genetic and/or pharmacological inhibition of mTOR kinase and GLS resulted in massive synergistic tumor cell death and growth inhibition in tumor-bearing mice. These results highlight a critical role for compensatory glutamine metabolism in promoting mTOR inhibitor resistance and suggest that rational combination therapy has the potential to suppress resistance.


Figures

Figure 7
Figure 7. Both mTOR and GLS inhibition attenuate energy production from the TCA cycle, leading to cell death in GBM.
GLS and glutamate levels are elevated following mTOR kinase inhibitor treatment of GBM cells. Combining mTOR kinase inhibitors with GLS inhibition provides a rational therapeutic strategy for patients with GBM.
Figure 6
Figure 6. Both mTOR and GLS inhibition demonstrated synergic tumor growth suppression in vivo.
(A) Each mouse was subcutaneously injected with 1 × 10⁶ U87 (on the left flank) and U87/EGFRvIII (on the right flank) cells. Mice bearing tumors were treated with intraperitoneal injections of PP242 (5 mg/kg) and/or compound 968 (5 mg/kg). The control group received an equal volume of DMSO. Treatment started 15 days after implantation. Tumor volume (in fold change) was measured at the indicated time points from each xenograft of 5 mice. Data represent the mean ± SEM of 3 independent experiments. **P < 0.01; ***P < 0.001. (B) Representative images of U87/EGFRvIII xenograft samples with TUNEL staining (brown cells) to assess apoptotic cells. Quantification of TUNEL staining was performed with ImageJ software. Data represent the mean ± SEM of 3 independent images for each group. ***P < 0.001. Scale bars: 50 μm. (C) GC/MS analysis targeting TCA cycle–related metabolites, pyruvate and oxaloacetic acid, citric and isocitric acid, succinic acid, fumaric acid, and malic acid in U87/EGFRvIII xenograft samples. Data represent the mean ± SEM of 3 independent xenografts for each group. *P < 0.05. (D) Effect of daily intraperitoneal injection of PP242 and/or compound 968 on changes in mouse body weight per group. Tukey-Kramer honest significance testing was performed for multiple comparisons testing. See also Supplemental Figures 10–13.
Figure 5
Figure 5. In response to mTOR inhibition, GLS promotes GBM cell survival in an αKG-dependent manner.
(A) The metabolite dm-αKG (10 mM) was tested for the ability to rescue the viability in U87/EGFRvIII cells treated with both 1 μM PP242 and 1 μM compound 968 for 3 days. Cell death was calculated by trypan blue exclusion. Data represent the mean ± SEM of 3 independent experiments. Tukey-Kramer honest significance testing was performed for multiple comparisons testing. **P < 0.01; ***P < 0.001. (B) GC/MS analysis targeting TCA cycle–related metabolites, pyruvate and oxaloacetic acid, citric and isocitric acid, succinic acid, fumaric acid, and malic acid in U87/EGFRvIII cells treated with 1 μM PP242 and/or 1 μM compound 968 with the normal DMEM or DMEM with dm-αKG (10 mM) for 24 hours. Data represent the mean ± SEM of 3 independent experiments. Tukey-Kramer honest significance testing was performed for multiple comparisons testing. *P < 0.05; **P < 0.01; ***P < 0.001.
Figure 4
Figure 4. GLS inhibition sensitized GBM cells to mTOR-targeted treatment.
(A) U87 and U87/EGFRvIII cells were transfected with 2 types of GLS siRNA and scrambled control siRNA constructs for 24 hours and changed to 10% FBS medium for 2 days. Cell number represents the mean ± SEM of 3 independent experiments. (B) Relative glutamine uptake and NH4+ production in control versus GLS knockdown U87 and U87/EGFRvIII cells. Data represent the mean ± SEM of 3 independent experiments. *P < 0.05, according to 2-tailed Student’s t test. (C) Immunoblot analysis using indicated antibodies of U87/EGFRvIII cells with the siRNA constructs against GLS or control LacZ treated with PP242 or control DMSO for 2 days. Images of GLS, p-AKT (Ser473), and AKT were obtained from another gel using the same cell lysate. (D) Representative images of U87/EGFRvIII GBM cells with TUNEL staining. Cells were transfected with siRNA against GLS and control LacZ treated with 1 μM PP242 or DMSO for 2 days. Quantification of TUNEL-positive cells was performed with ImageJ software. Data represent the mean ± SEM of 3 independent images for each group. **P < 0.01, according to 2-tailed Student’s t test. Scale bars: 100 μm. (E) TUNEL staining in U87/EGFRvIII and SVGP12 cells treated with 1 μM PP242 and/or 1 μM compound 968 for 2 days. Quantification of TUNEL-positive cells was performed with ImageJ software. Data represent the mean ± SEM of 3 independent images for each group. Tukey-Kramer honest significance testing was performed for multiple comparisons testing. ***P < 0.001. See also Supplemental Figures 6–9.
Figure 3
Figure 3. Compensatory elevation of GLS protein and glutamate levels enables GBM cells to survive mTOR inhibitor treatment.
(A and B) Intracellular levels of l-glutamate (A) and αKG (B) in U87/EGFRvIII GBM cells treated with 1 nM rapamycin, 1 μM PP242, or control DMSO for 48 hours. Data represent the mean ± SEM of 3 independent experiments. *P < 0.05; **P < 0.01; ***P < 0.001, according to 2-tailed Student’s t test. (C) Schematic showing the enzymes involved in glutaminolysis that were targeted in this study. ADP, adenosine diphosphate; Pi, phosphate. (D) mRNA levels of GS, GLS, solute-linked carrier family A1 (SLC1A5), and GDH in U87 and 87/EGFRvIII cells. Cells were treated with 1 nM rapamycin, 1 μM PP242, or control DMSO for 48 hours. Data represent the mean ± SEM of 3 independent experiments. *P < 0.05; **P < 0.01, according to 2-tailed Student’s t test. (E) Immunohistochemical images of GLS obtained from EGFRvIII-expressing U87 xenografts that received treatment with PP242 (n = 2) or control DMSO (n = 2) for 5 days. Tissue was counterstained with hematoxylin. Scale bars: 50 μm. Relative staining intensity was measured from 6 independent images for each group. **P < 0.01, according to 2-tailed Student’s t test. See also Supplemental Figures 2-5 and Supplemental Table 1.
Figure 2
Figure 2. Comparative metabolomics identifies glutamate as a potential metabolite that promotes resistance to mTOR inhibitor treatment.
Heat map representation of a 2D hierarchical clustering of metabolites identified as differentially expressed among U87/EGFRvIII GBM cells treated with 1 nM rapamycin, 1 μM PP242, and control DMSO for 48 hours. Each column represents a treatment group, and each row represents a metabolite.
Figure 1
Figure 1. Glutamine and glutamate levels and GLS expression are elevated in the tumors of GBM patients.
(A) MRS studies targeting glutamine and glutamate for tumors (red) and contralateral normal brain (blue) regions in a 68-year-old patient with GBM. The peaks of choline, glutamine and glutamate complex, and NAA are around 3.22, 2.4, and 2.0 ppm of chemical shift, respectively. Cho, choline; Cr, Creatine; Gln, glutamine; Glu, glutamate. (B) Glutamine and glutamate levels in MRS studies for tumors and contralateral normal brain regions in 12 GBM patients. The relative level of glutamine and glutamate was calculated with respect to creatine and phosphocreatine for VOIs of tumor and contralateral normal brain. *P < 0.05; ***P < 0.001, according to 2-tailed Student’s t test. (C) mRNA levels of key enzymes including GLS and GS between glutamine and glutamate in 12 GBM patients. The relative levels of GLS and GS are presented as the tumor/normal brain (T/N) expression ratio. (D) Immunoblot analysis of GLS staining in tumor and normal brain tissue obtained at tumor resection from 6 patients with GBM. See also Supplemental Figure 1.

References

    1. Vander Heiden MG, Cantley LC, Thompson CB. Understanding the Warburg effect: the metabolic requirements of cell proliferation. Science. 2009;324(5930):1029–1033. doi: 10.1126/science.1160809. - DOI - PMC - PubMed
    1. Buchakjian MR, Kornbluth S. The engine driving the ship: metabolic steering of cell proliferation and death. Nat Rev Mol Cell Biol. 2010;11(10):715–727. doi: 10.1038/nrm2972. - DOI - PubMed
    1. Lunt SY, Vander Heiden MG. Aerobic glycolysis: meeting the metabolic requirements of cell proliferation. Ann Rev Cell Dev Biol. 2011;27:441–464. doi: 10.1146/annurev-cellbio-092910-154237. - DOI - PubMed
    1. Wise DR, Thompson CB. Glutamine addiction: a new therapeutic target in cancer. Trends Biochem Sci. 2010;35(8):427–433. doi: 10.1016/j.tibs.2010.05.003. - DOI - PMC - PubMed
    1. Seltzer MJ, et al. Inhibition of glutaminase preferentially slows growth of glioma cells with mutant IDH1. Cancer Res. 2010;70(22):8981–8987. doi: 10.1158/0008-5472.CAN-10-1666. - DOI - PMC - PubMed

Publication types

MeSH terms