. 2015 Apr;125(4):1579-90.
doi: 10.1172/JCI76468. Epub 2015 Mar 23.

NOTCH reprograms mitochondrial metabolism for proinflammatory macrophage activation

NOTCH reprograms mitochondrial metabolism for proinflammatory macrophage activation

Jun Xu et al. J Clin Invest. 2015 Apr.

Abstract

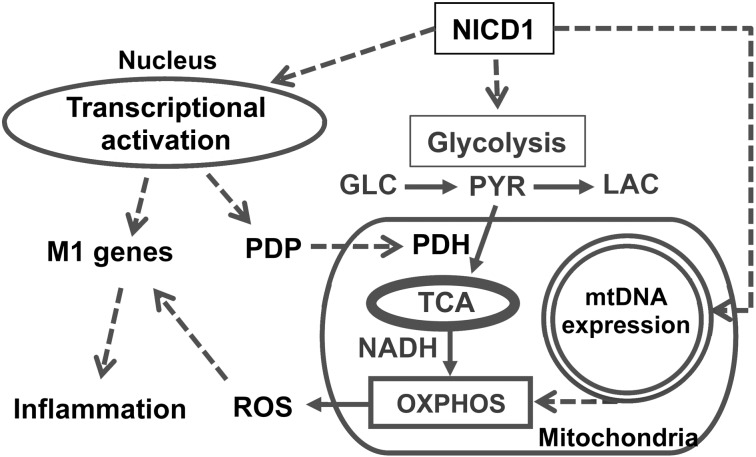
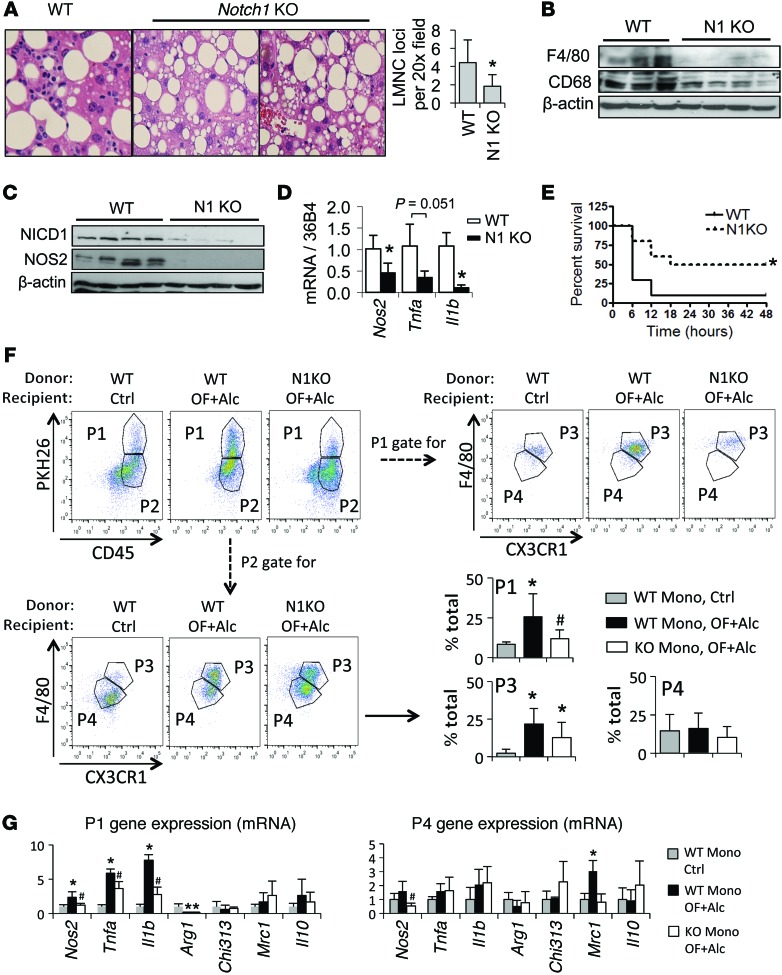
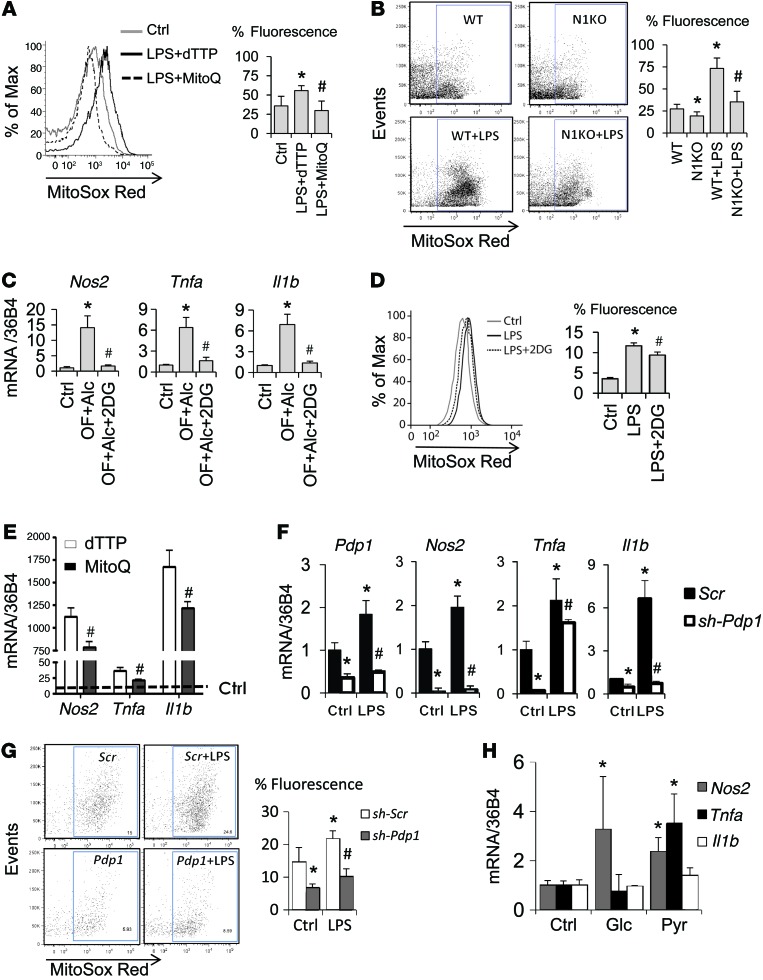
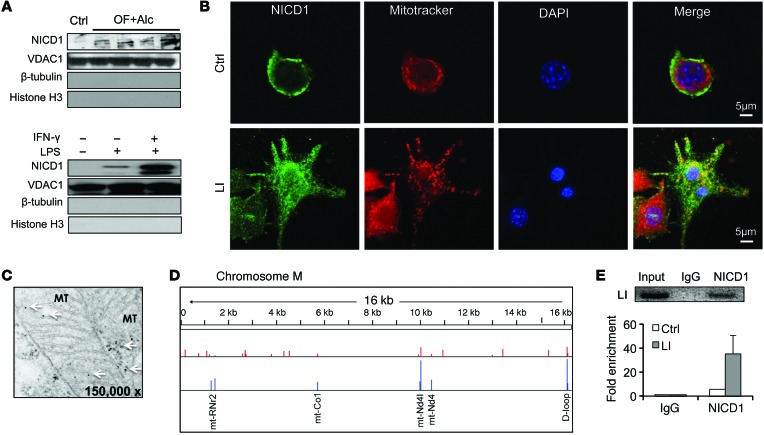
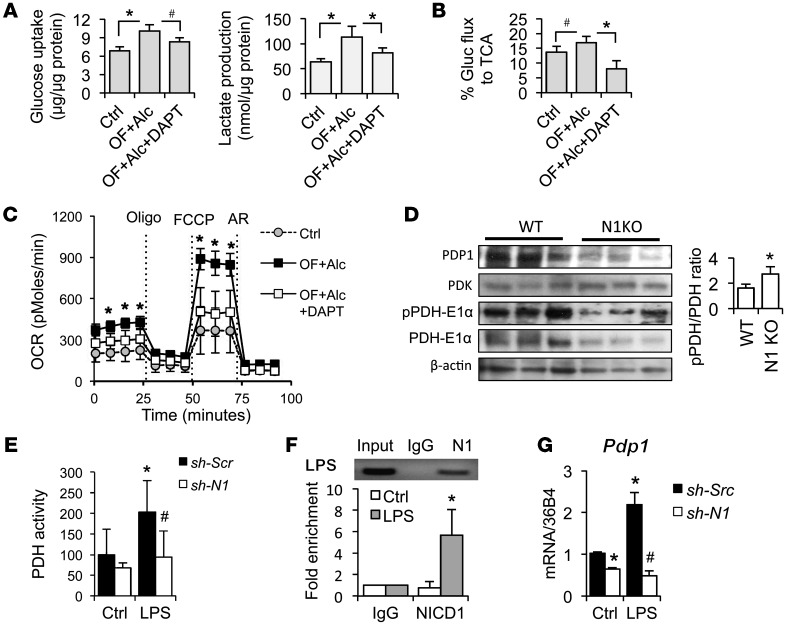
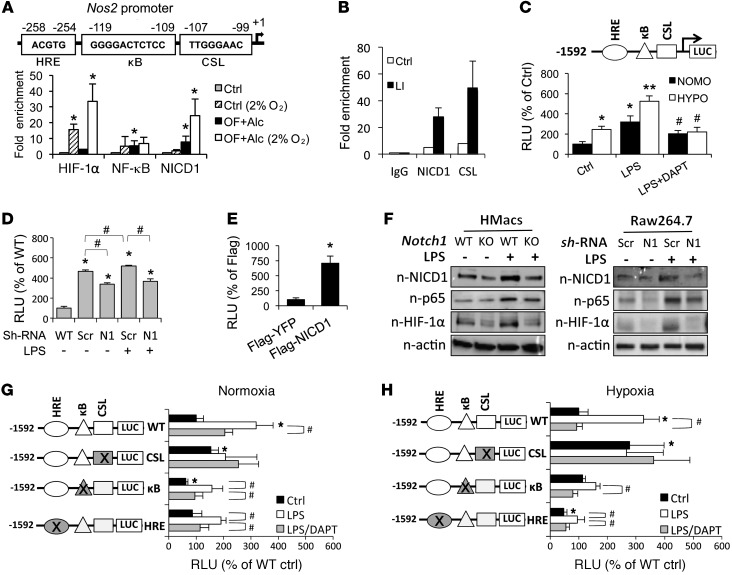
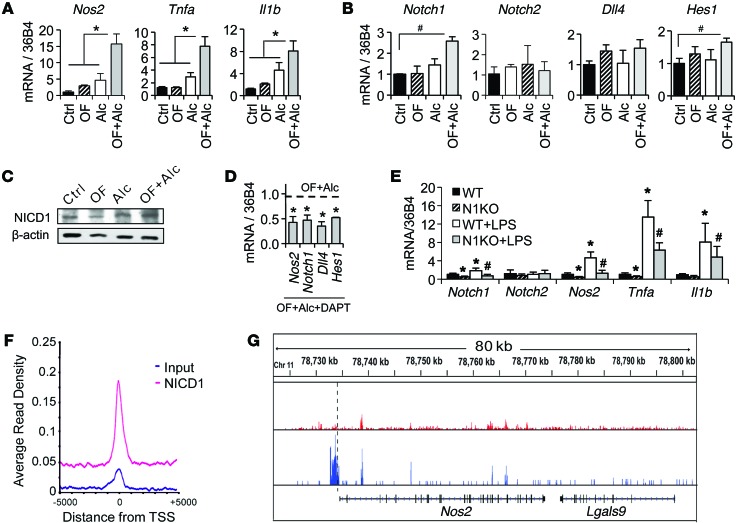
Metabolic reprogramming is implicated in macrophage activation, but the underlying mechanisms are poorly understood. Here, we demonstrate that the NOTCH1 pathway dictates activation of M1 phenotypes in isolated mouse hepatic macrophages (HMacs) and in a murine macrophage cell line by coupling transcriptional upregulation of M1 genes with metabolic upregulation of mitochondrial oxidative phosphorylation and ROS (mtROS) to augment induction of M1 genes. Enhanced mitochondrial glucose oxidation was achieved by increased recruitment of the NOTCH1 intracellular domain (NICD1) to nuclear and mitochondrial genes that encode respiratory chain components and by NOTCH-dependent induction of pyruvate dehydrogenase phosphatase 1 (Pdp1) expression, pyruvate dehydrogenase activity, and glucose flux to the TCA cycle. As such, inhibition of the NOTCH pathway or Pdp1 knockdown abrogated glucose oxidation, mtROS, and M1 gene expression. Conditional NOTCH1 deficiency in the myeloid lineage attenuated HMac M1 activation and inflammation in a murine model of alcoholic steatohepatitis and markedly reduced lethality following endotoxin-mediated fulminant hepatitis in mice. In vivo monocyte tracking further demonstrated the requirement of NOTCH1 for the migration of blood monocytes into the liver and subsequent M1 differentiation. Together, these results reveal that NOTCH1 promotes reprogramming of mitochondrial metabolism for M1 macrophage activation.


Figures

Figure 7
Figure 7. NOTCH activation reprograms mitochondrial metabolism to augment Mac M1 gene expression.
NOTCH1 activation results in liberation of NICD1, which translocates into the nucleus to activate transcription of M1 genes, such as Nos2 and the metabolic gene Pdp1. NOTCH1 activation enhances glycolysis and concurrent glucose flux to the TCA cycle through upregulation of Pdp1 and subsequent PDH activity. NICD1 also translocates to the mitochondrial and promotes mtDNA transcription in M1 Macs. The increased mtDNA expression and glucose oxidation lead to enhanced OXPHOS and consequent mtROS, which in turn augments expression of M1 genes. GLC, glucose; PYR, pyruvate; LAC, lactate.
Figure 6
Figure 6. Inhibition of NOTCH pathway in vivo attenuates HMac M1 activation and liver inflammation.
(A) Representative liver histology (H&E; original magnification, ×200) of WT and Notch1 KO mice with OF+Alc feeding, with average loci of liver mononuclear cells (LMNCs) per ×200 optical field (n = 6). *P < 0.05, t test. (B and C) Immunoblot of (B) CD68 and F4/80 in the livers and (C) NICD1 and NOS2 in HMacs of WT and myeloid Notch1 KO mice with OF+Alc feeding. (D) Expression of M1 genes in HMacs from the WT and Notch1 KO mice with OF+Alc feeding (n = 6). *P < 0.05 vs. WT, t test. (E) Survival rate of mice injected intravenously with galactosamine (350 mg/kg) and LPS (4 μg/kg) in 200 μl PBS (n = 10 per group). *P < 0.01, log-rank test. (F) FACS analysis of HMacs isolated from WT mice receiving WT or Notch1 KO donor monocytes. After gating on CD45, HMacs were separated into PKH26+ P1 and PKH26 P2 populations, which were further separated into P3 and P4 populations using Mac markers F4/80 and CX3CR1. The percentage of P1, P3, and P4 cells of total HMacs are presented in bar graphs (n = 6–8). Mono, monocytes. *P < 0.05 vs. WT donor and control recipient mice, #P < 0.05 vs. WT donor and OF+Alc recipient mice, 1-way ANOVA. (G) Expression of M1 vs. M2 genes in infiltrating P1 donor monocytes/Macs and in resident P4 recipient Kupffer cells (n = 6–8). *P < 0.05 vs. WT donor and control recipient mice, #P < 0.05 vs. WT donor and OF+Alc recipient mice, 1-way ANOVA.
Figure 5
Figure 5. NOTCH-dependent glucose oxidation and mtROS augment M1 activation.
(A) FACS analysis of mtROS using MitoSox Red in WT primary HMacs pretreated with or without dTTP or MitoQ for 1 hour followed by LPS for 24 hours. dTTP served as a pharmacologic control for MitoQ (n = 4–6). *P < 0.05 vs. control, #P < 0.05 vs. LPS plus dTTP, 1-way ANOVA. (B) FACS analysis of mtROS using MitoSox Red in WT or Notch1 KO HMacs treated with or without LPS for 24 hours (n = 6–8). *P < 0.05 vs. WT, #P < 0.05 vs. WT+LPS, 1-way ANOVA. (C) 2-DG reduces the expression of M1 genes in HMacs from OF+Alc mice (n = 3). *P < 0.05 vs. control, #P < 0.05 vs. OF+Alc, 1-way ANOVA. (D) 2-DG attenuates mtROS in LPS-induced M1 Raw 264.7 cells (n = 3). *P < 0.05 vs. control, #P < 0.05 vs. LPS, 1-way ANOVA. (E) MitoQ suppresses the expression of M1 genes in M1 Raw 264.7 cells treated with LI for 4 hours (n = 3). The dashed line indicates the mRNA levels of control cells, which are set to 1. #P < 0.05 vs. LI+dTTP, t test. (F and G) Pdp1 silencing abrogates the expression of (F) M1 genes or (G) mtROS in Raw 264.7 cells infected with scrambled or Pdp1 shRNA with or without LPS treatment (n = 4–6). *P < 0.01 vs. Scr control, #P < 0.01 vs. Scr LPS, 2-way ANOVA. (H) Expression of M1 genes in WT HMacs cultured in glucose/pyruvate-free medium (control) or supplemented with either glucose (5.5 mM) or pyruvate (10 mM) (n = 6). *P < 0.05 vs. control, t test.
Figure 4
Figure 4. NOTCH regulates mtDNA transcription.
(A) Immunoblot of NICD1 of mitochondrial proteins from control or OF+Alc HMacs and Raw 264.7 cells treated with or without LPS or IFN-γ for 24 hours. VDAC1 served as a loading control, and the absence of β-tubulin or histone H3 validates the purity of mitochondrial proteins. (B) Fluorescent confocal microscopy shows the colocalization of NICD1 (green) and MitoTracker (red) in Raw 264.7 cells treated with LPS plus LI for 24 hours. Results are representative of 5 different experiments. Scale bars: 5 μm. (C) Electron microscopy image (original magnification, ×150,000) of immunogold-NICD1 in mitochondria (MT) of Raw 264.7 cells stimulated with LPS for 24 hours, as indicated by arrows. Results are representative of 3 different experiments. (D) ChIP-seq analysis on mtDNA from Raw 264.7 cells stimulated with LPS for 24 hours. Integrative Genomics Viewer genome browser tracks show the levels of NOTCH1 ChIP sample (blue) over input (red). Different genomic coordinates and genome window size for ChrM (chr17:23,695,786–23,710,730; 15 kb) are shown along with mm9 RefSeq data. (E) Mitochondrial ChIP-qPCR with primers specific for the D-loop region (15,752–15,903 bp) of the mitochondrial genome in Raw 264.7 cells stimulated with LPS for 24 hours. Values are fold enrichments relative to control or LPS IgG and represent 1 pooled mtDNA sample from 10 × 10 cm plates of control cells and 2 pooled mtDNA samples from 10 × 10 cm plates per each LPS-treated cell.
Figure 3
Figure 3. NOTCH reprograms M1 Macs to glucose mitochondrial oxidation through upregulation of PDP1.
(A) Increased glucose uptake and lactate production by M1 Hmacs is attenuated with DAPT (n = 6). *P < 0.001, #P < 0.05, 1-way ANOVA. (B) Primary HMacs were cultured with 99.9% [U-13C6]-glucose (1 g/l), with or without DAPT. Percentage glucose flux to the TCA cycle was determined by mass spectrometry (n = 6). *P < 0.001, #P < 0.05, 1-way ANOVA. (C) Seahorse analysis of OCR in HMacs. ATP synthase inhibitor oligomycin (Oligo), mitochondrial uncoupling agent FCCP, and ETC inhibitors antimycin and rotenone (AR) were given at indicated times (n = 5). *P < 0.05 vs. control or OF+Alc+DAPT, t test. (D) Immunoblot of PDP1, PDK, and total and phospho–PDH-E1α (pSer293) in HMacs isolated from WT and Notch1 KO mice with OF+Alc feeding. ImageJ quantification of the pPDH-E1α/PDH-E1α ratio is shown (n = 3). *P < 0.05, t test. (E) PDH activity in Raw 264.7 cells infected with lentiviral scrambled or Notch1 shRNA, treated with or without LPS. Values are relative activity to the control (n = 6). *P < 0.05 vs. sh-Scr, #P < 0.05 vs. sh-Scr + LPS, 2-way ANOVA. (F) ChIP-qPCR for NICD1 (N1) at the CSL site of Pdp1 promoter in Raw 264.7 cells stimulated with or without LPS for 4 hours. Values are fold enrichments relative to IgG (n = 3). *P < 0.05 vs. control NICD1, t test. (G) Expression of Pdp1 in Raw 264.7 cells infected with scrambled or Notch1 shRNA, stimulated with or without LPS for 24 hours (n = 3). *P < 0.05 vs. scrambled control, #P < 0.05 vs. scrambled LPS, 2-way ANOVA.
Figure 2
Figure 2. NOTCH directly activates Nos2 transcription.
(A) Schematic response elements for HIF-1α (HRE), NF-κB (κB), and NOTCH partner CSL in murine Nos2 promoter. ChIP-qPCR on these sites in cultured HMacs under either 21% (normoxia) or 2% (hypoxia) oxygen for 16 hours. Values are fold enrichment relative to control after normalization with IgG (n = 3). *P < 0.05 vs. control under normoxia, t test. (B) ChIP-qPCR for NICD1 and CSL (RBP-Jκ) in Raw 264.7 cells treated with or without LI. Results are representative of 2 separate experiments. (C) Luciferase Nos2 promoter activity in Raw 264.7 cells treated with vehicle, DAPT, or LPS plus DAPT under 21% (NOMO) or 2% (HYPO) O2. Values are percentage change of Firefly over Renilla luciferase activity as compared with control under NOMO (n = 4). *P < 0.05 vs. normoxic control, **P < 0.05 vs. hypoxic control, #P < 0.05 with LPS treatment under respective conditions, 2-way ANOVA. (D) Nos2 promoter activity in Raw 264.7 cells transduced with nothing (WT) or scrambled (Scr) or Notch1 (N1) shRNA, with or without LPS for 4 hours (n = 5–8). *P < 0.05 vs. WT, #P < 0.05, 1-way ANOVA. (E) Nos2 promoter activity in Raw 264.7 cells overexpressing 3xflag-YFP or 3xflag-NICD1 (n = 5). *P < 0.05, t test. (F) Western blots of nuclear proteins NICD1, p65, and HIF-1α. (G and H) Effects of HRE, NF-κB, or CSL site mutation on Nos2 promoter activity under (G) normoxia and (H) hypoxia. Raw 264.7 cells transfected with WT or mutant Nos2 promoter luciferase reporters were treated with or without DAPT or LPS for 4 hours (n = 5–8). *P < 0.05 vs. untreated WT, #P < 0.05 between the treatments, t test.
Figure 1
Figure 1. NOTCH-dependent expression of M1 genes.
(A) Expression of M1 genes and (B) NOTCH receptors, Notch1 and Notch2, ligand, Dll4, and target, Hes1, in HMacs from control (Ctrl), high-fat diet–overfed (OF), alcohol (Alc), or combined OF+Alc mice (n = 3–5 per group). *P < 0.01, #P < 0.05, 1-way ANOVA. (C) Immunoblot showing increased NICD1 in HMacs from the OF+Alc mice. Results are representative of 4 different experiments. (D) DAPT suppresses gene expression in HMacs from OF+Alc mice (n = 3–5 per group). The dashed line refers to the mRNA levels of untreated HMacs, which are set at 1 for comparisons with DAPT-treated HMacs, both of which were isolated from the OF+Alc mice. *P < 0.05 vs. DAPT-untreated cells, t test. (E) Gene expression in cultured HMacs from WT and Notch1 KO mice treated with or without LPS (10 ng/ml, 4 hours) (n = 6 per group). *P < 0.05 vs. WT, #P < 0.05 vs. WT+LPS, 1-way ANOVA. (F) Average ChIP enrichment signals are shown over regions spanning ±5 kb around the transcription start sites (TSSs) of all the mouse genes from UCSC RefSeq database. Blue and red lines indicate the input (no immunoprecipitation) level and NICD1 enrichment by ChIP-seq, respectively. (G) Integrative Genomics Viewer genome browser tracks show the level of NICD1 enrichment near the Nos2 transcription start site in ChIP samples (blue) over input (red). Different genomic coordinates and genome window size for Nos2 (chr11:101,691,391-101,717,344; 26 kb) are shown with mm9 reference sequence (RefSeq) data. The transcription start site is shown by the dashed line.

Comment in

References

    1. Murray PJ, Wynn TA. Protective and pathogenic functions of macrophage subsets. Nat Rev Immunol. 2011;11(11):723–737. doi: 10.1038/nri3073. - DOI - PMC - PubMed
    1. Lacy-Hulbert A, Moore KJ. Designer macrophages: oxidative metabolism fuels inflammation repair. Cell Metab. 2006;4(1):7–8. doi: 10.1016/j.cmet.2006.06.001. - DOI - PubMed
    1. Agathocleous M, Harris WA. Metabolism in physiological cell proliferation and differentiation. Trends Cell Biol. 2013;23(10):484–492. doi: 10.1016/j.tcb.2013.05.004. - DOI - PubMed
    1. Artavanis-Tsakonas S, Rand MD, Lake RJ. Notch signaling: cell fate control and signal integration in development. Science. 1999;284(5415):770–776. doi: 10.1126/science.284.5415.770. - DOI - PubMed
    1. Mumm JS, Kopan R. Notch signaling: from the outside in. Dev Biol. 2000;228(2):151–165. doi: 10.1006/dbio.2000.9960. - DOI - PubMed

Publication types

MeSH terms