. 2015 Dec 10;34(50):6040-54.
doi: 10.1038/onc.2015.52. Epub 2015 Mar 23.

YAP forms autocrine loops with the ERBB pathway to regulate ovarian cancer initiation and progression

Affiliations

YAP forms autocrine loops with the ERBB pathway to regulate ovarian cancer initiation and progression

C He et al. Oncogene. .

Abstract

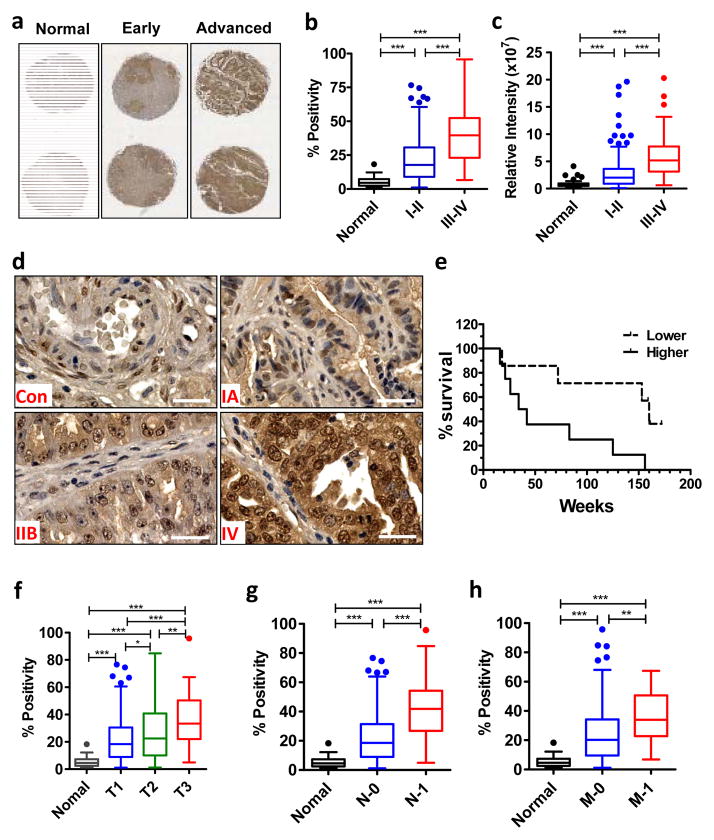
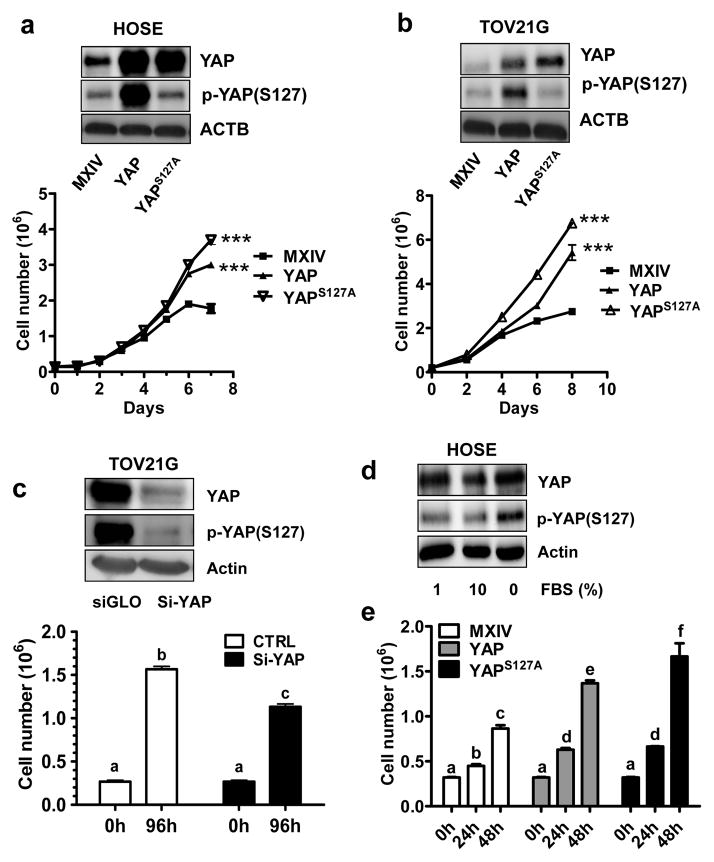
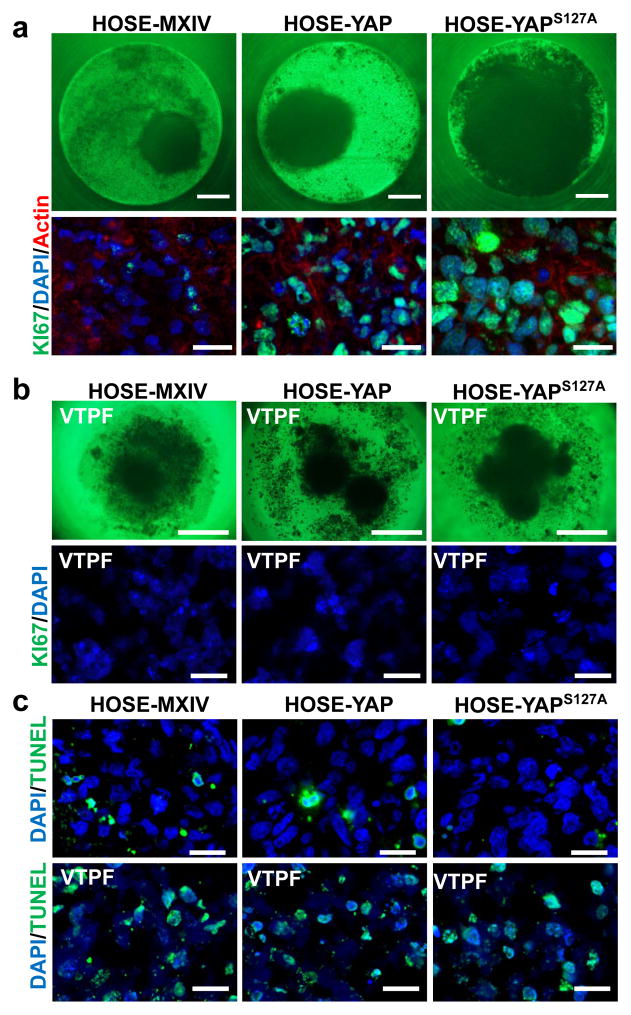
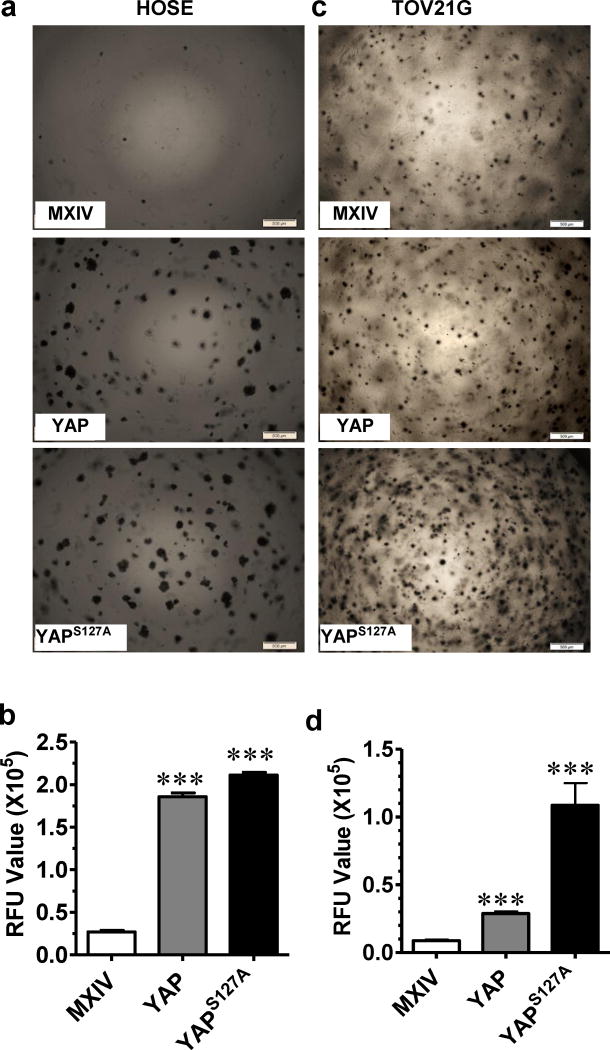
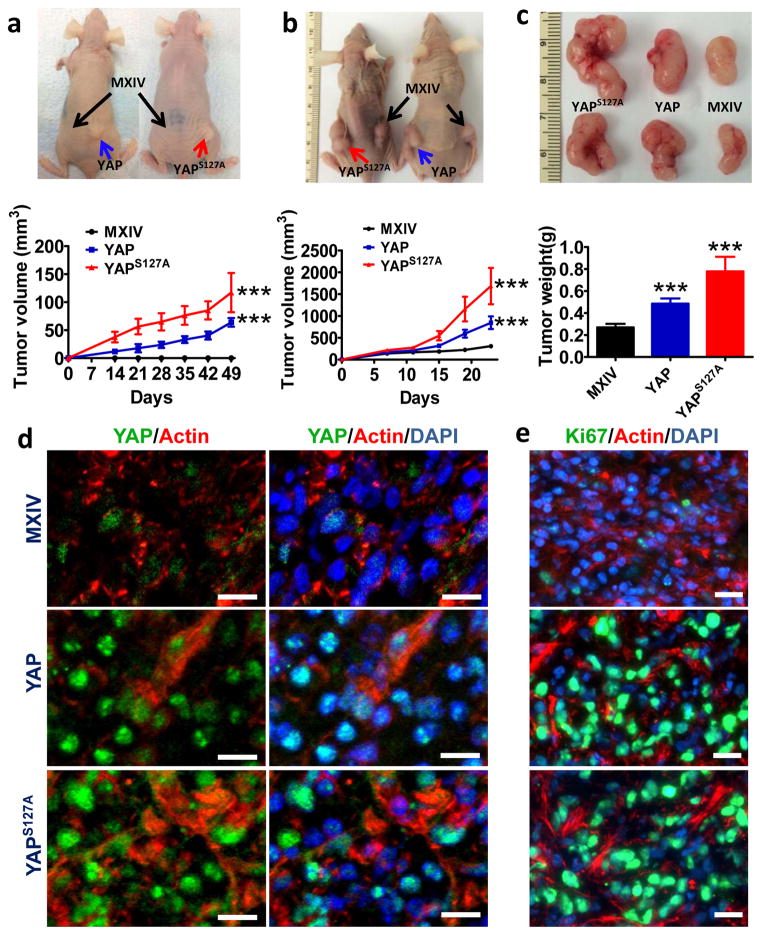
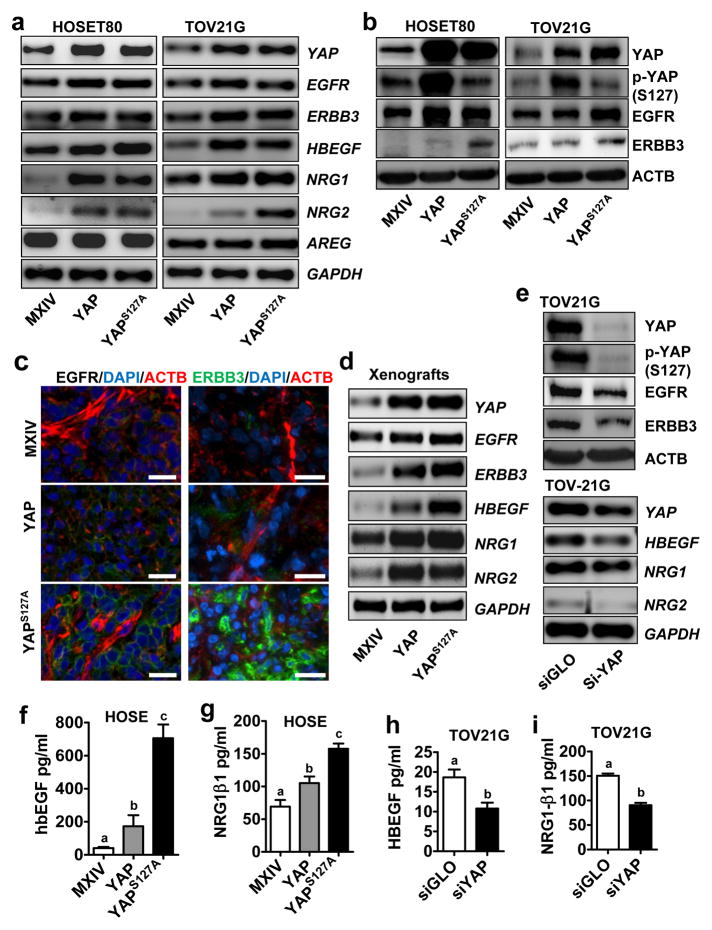
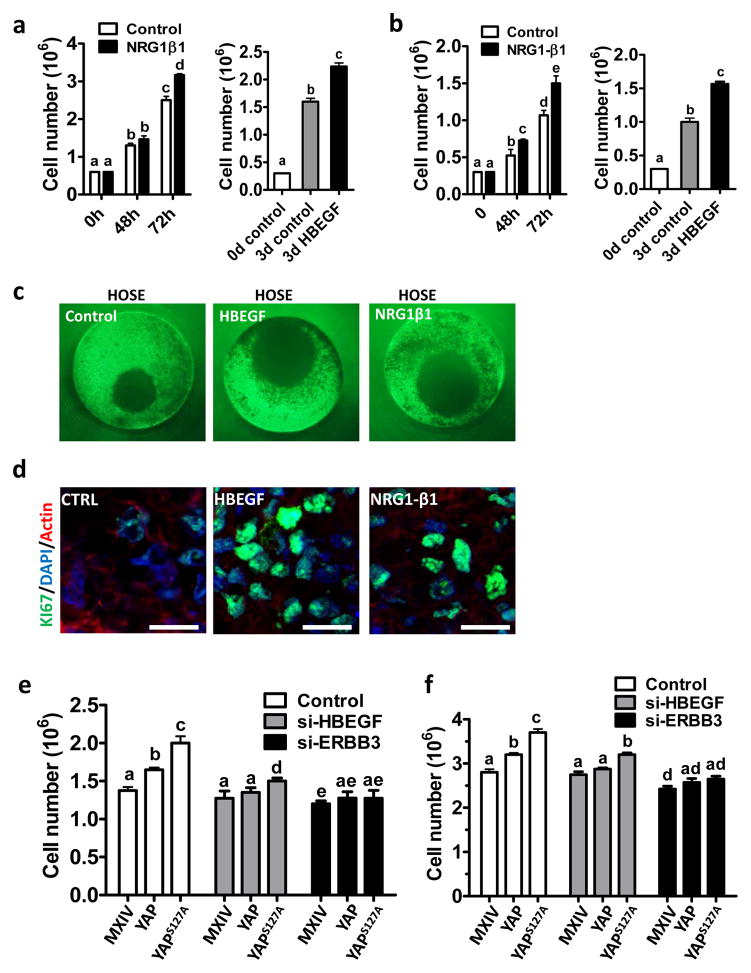
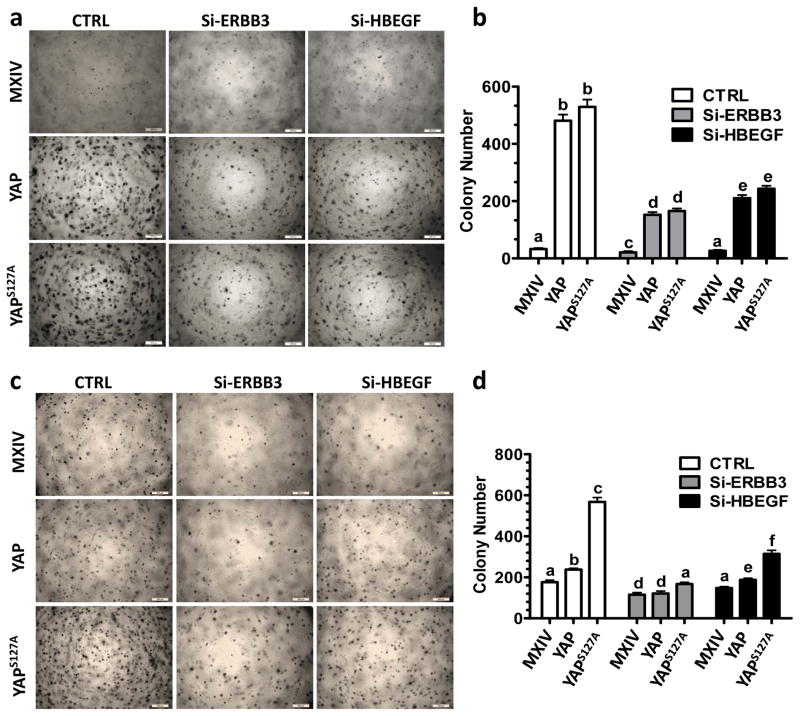
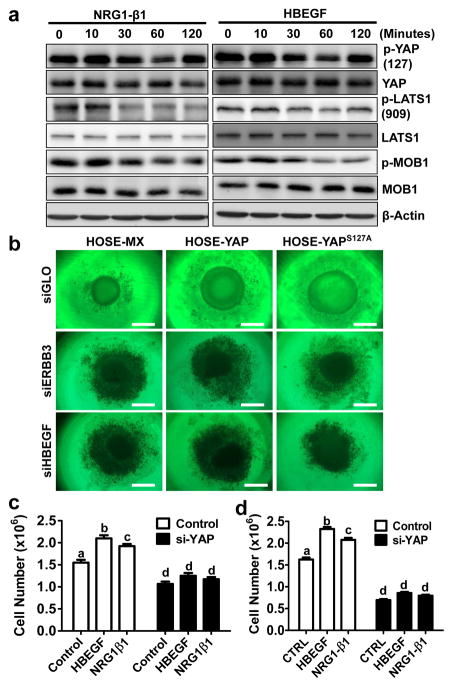
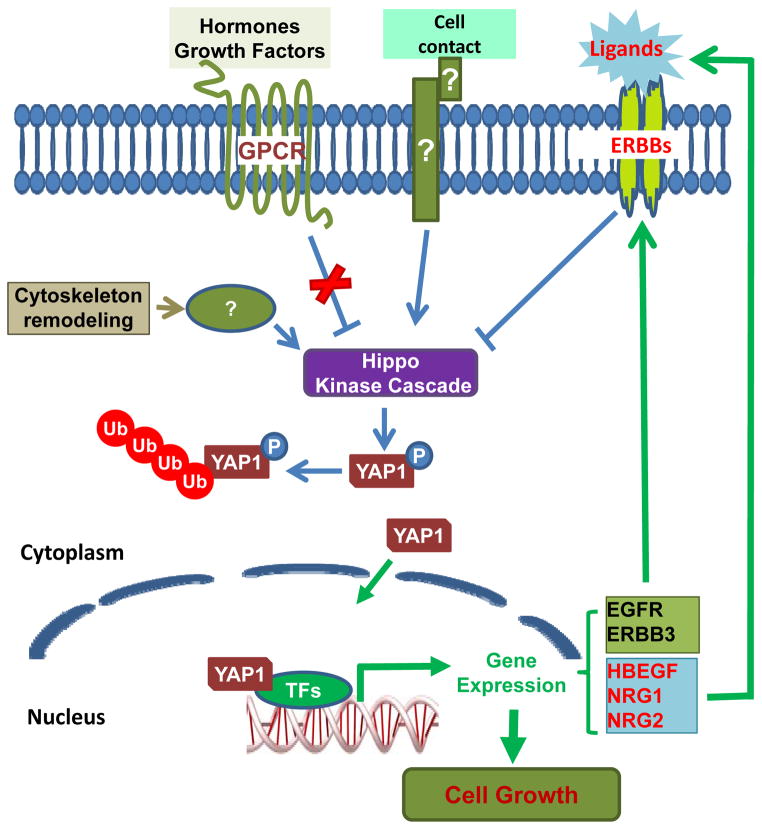
Mechanisms underlying ovarian cancer initiation and progression are unclear. Herein, we report that the Yes-associated protein (YAP), a major effector of the Hippo tumor suppressor pathway, interacts with ERBB signaling pathways to regulate the initiation and progression of ovarian cancer. Immunohistochemistry studies indicate that YAP expression is associated with poor clinical outcomes in patients. Overexpression or constitutive activation of YAP leads to transformation and tumorigenesis in human ovarian surface epithelial cells, and promotes growth of cancer cells in vivo and in vitro. YAP induces the expression of epidermal growth factor (EGF) receptors (EGFR, ERBB3) and production of EGF-like ligands (HBEGF, NRG1 and NRG2). HBEGF or NRG1, in turn, activates YAP and stimulates cancer cell growth. Knockdown of ERBB3 or HBEGF eliminates YAP effects on cell growth and transformation, whereas knockdown of YAP abrogates NRG1- and HBEGF-stimulated cell proliferation. Collectively, our study demonstrates the existence of HBEGF & NRGs/ERBBs/YAP/HBEGF & NRGs autocrine loop that controls ovarian cell tumorigenesis and cancer progression.


Conflict of interest statement

Conflict of interest: The authors have no competing interests to declare.

Figures

Fig. 1
Fig. 1. Immunohistochemical analysis of YAP expression in ovarian tumor tissues
a) Representative images showed YAP protein distribution in tissues from age matched normal ovaries, early stage tumors and advanced stage tumors. b) Quantitative data showing the relationship of YAP positivity and tumor stages. c) Quantitative data showing the relationship of YAP relative intensity and tumor stages. d) Representative high-resolution images showing the subcellular distribution of YAP protein in the ovarian cancer tissues. Con: normal control; IA, IIB and IV: tumor stage IA, IIB, and IV; Scale bar: 40μm. e) Correlation between progression free survival and YAP protein expression in patient tissues. The patient samples with survival data were stratified in two groups based on the intensity of YAP immunostaining. f, g & h) Relationship between YAP staining positivity and primary tumor size (f), involvement of lymph node (g) and tumor metastasis status (h). Positivity: the number of YAP positive cells relative to the total cell number. For all bar graphs, each bar represents mean ± SEM (see n values in table 1). Bars with different letters are significantly different from each other (p < 0.05).
Fig. 2
Fig. 2. YAP promotes proliferation in normal and cancerous ovarian cells
a) Top panel: Western blot detection of YAP and phosphorylated YAP levels in HOSE-MXIV, HOSE-YAP and HOSE-YAPS127A cells. Lower panel: Growth curve of HOSE-MXIV, HOSE-YAP and HOSE-YAPS127A cells cultured in medium in the presence of 10% FBS. b) Top panel: Western blot detection of YAP and phosphorylated YAP levels in TOV21G-MXIV, TOV21G -YAP and TOV21G -YAPS127A cells; Lower panel: Growth curve of TOV21G -MXIV, TOV21G -YAP and TOV21G -YAPS127A cells cultured in medium in the presence of 10% FBS. c) Top panel: Western blot detection of YAP protein before and after knockdown of YAP in TOV21G cells. YAP siRNA (si-YAP) successfully knocked down YAP protein. Lower panel, change of cell growth after knockdown of YAP in TOV21G cells. d) Western blot showing the effect of FBS on the expression and phosphorylation of YAP protein in HOSE cells. e) Growth of HOSE cell lines with different levels and activities of YAP in serum reduced culture medium (1% FBS). For all representative graphs, each point or bar represents mean ± SEM of 4 repeats. Bars with different letters are significantly different from each other. ***: p < 0.001 compared with control group (MXIV).
Fig. 3
Fig. 3. YAP promotes cell growth and cell-cell communication in a 3D hanging drop culture system
a) Top panel: Representative images showing the spheroids derived from HOSE-MXIV, HOSE-YAP and HOSE-YAPS127A cells growing in a 3D hanging drop culture system for 16 days. Lower panel: Ki67 staining (green) showing the differential proliferation of three cell lines in the spheroids. Nuclei were stained with DAPI (blue). Actin filaments were stained with rhodamin-phalloidin (red). Scale bar: 20μm. b) Top panel: Representative images showing the spheroids derived from HOSE-MXIV, HOSE-YAP and HOSE-YAPS127A cells growing in 3D-culture system for 16 days in the presence of verteporfin (VTPF, 5μM, YAP antagonist). Lower panel: Ki67 staining (green) showing the proliferation of three cell lines in the spheroids treated with 5μM verteporfin (VTPF). Nuclei were stained with DAPI (blue). Scale bar: 20μm. C) TUNEL assay to examine the apoptosis of cells in the spheroids derived from HOSE cell lines in the presence or absence of 5μM verteporfin (VTPF). Apoptotic cells were labeled with green color. Nuclei were stained with DAPI. Scale bar: 20μm.
Fig. 4
Fig. 4. Overexpression of wild type YAP or constitutively active YAP transformed human ovarian surface epithelial cells and enhanced anchorage-independent growth of ovarian cancer cells
a) Soft agar assay showing colony formation in HOSE-MXIV, HOSE-YAP and HOSE-YAPS127A cells. b). Fluorescence-based quantitative soft agar assay showing the relative colony number in HOSE-MXIV, HOSE-YAP and HOSE-YAPS127A cells. c) Soft agar assay showing colony formation in TOV21G-MXIV, TOV21G -YAP and TOV21G -YAPS127A cells. d) Fluorescence-based quantitative soft agar assay showing the relative colony number in HOSE-MXIV, HOSE-YAP and HOSE-YAPS127A cells. RFU: Relative Fluorescence unit. For both graphs, each bar represents mean ± SEM of four repeat assays. ***: p < 0.001 compared with control (MXIV).
Fig. 5
Fig. 5. Overexpression of wild type YAP or constitutively active YAP initiate tumor in immortalized human ovarian surface epithelial cells and enhance cancer cell growth in vivo
a) Top panel, representative images showing tumorigenesis in HOSE-derived cell lines (HOSE-MXIV, HOSE -YAP and HOSE-YAPS127A cells) implanted into athymic nude mice. Lower panel, growth curve of tumor xenografts derived from transformed HOSE cell lines. b) Top panel, representative images showing tumorigenesis in TOV21G-derived cell lines (TOV21G-MXIV, TOV21G-YAP and TOV21G-YAPS127A cells) implanted in athymic nude mice. Lower panel, growth curve of tumor xenografts derived from TOV21G-derived cell lines. c) Top panel: representative images of the tumor xenografts derived from TOV21G-MXIV, TOV21G-YAP and TOV21G-YAPS127A cells. Lower panel: the weight of tumors derived from YAP-transfected TOV21G cells. For all representative graphs, each point or bar represents mean ± SEM (n = 10 for control; n = 5 for YAP and YAPS127A). ***: P < 0.001 compared with control (MXIV). d) Immunofluorescent histochemical analysis to determine the expression of YAP (green) in the tumor tissue derived from TOV21G-MXIV, TOV21G-YAP and TOV21G-YAPS127A cells. e) Immunofluorescent histochemical analysis to determine the expression of Ki67 (green) in the tumor tissue derived from TOV21G-MXIV, TOV21G-YAP and TOV21G-YAPS127A cells. Nuclei were stained with DAPI (blue) and actin was stained with Phalloidin-rhdomine (Red) in both d) & e). Scale bar: 10μm.
Fig. 6
Fig. 6. YAP regulates expression of EGF-like ligands and ERBB receptors
a) Determine the mRNA expression of NRG1, NRG2, HBEGF, EGFR and ERBB3 in HOSE-MXIV, HOSE-YAP and HOSE-YAPS127A cells (left panel), and in TOV21G-MXIV, TOV21G-YAP & TOV21G-YAPS127A cells (right panel) using RT-PCR. b) Determine protein levels of YAP, phosphorylated YAP [p-YAP (S127)], EGFR, and ERBB3 in HOSE-MXIV, HOSE-YAP and HOSE-YAPS127A cells (left panel), and in TOV21G-MXIV, TOV21G-YAP & TOV21G-YAP S127A cells (right panel). c) Determine the expression of EGFR (left, green) and ERBB3 (right, green) in xenograft tumors derived from the TOV21G-MXIV, TOV21G-YAP & TOV21G-YAPS127A cell lines using Fluorescent immunohistochemistry. Actin was stained with rhodamine-phalloidin (red). Nuclei were stained with DAPI (blue). Scale bar: 20μm. d) mRNA levels of ERBB1, ERBB3, HBEGF and NRGs in the tumor xenografts derived from TOV21G-MXIV, TOV21G-YAP, and TOV21G-YAPS127A cells. e) Top panel: Western blot analysis to detect the expression of YAP, EGFR and ERBB3 protein in TOV21G cells with or without YAP knockdown using YAP siRNA (si-YAP). siGLO (a non-target siRNA) was used as a negative control; Lower panel: mRNA levels of NRG1, NRG2 and HBEGF before and after Knockdown of YAP with YAP siRNA (si-YAP). f & g) Concentrations of HBEGF and NRG1β1 in the medium of HOSE-MXIV, HOSE-YAP & HOSE-YAP S127A cells. h & i) Concentrations of HBEGF and NRG1β1 in the medium of TOV21G cells transfected with non-targeting control siRNA (siGLO) or YAP siRNA (siYAP). All experiments were repeated at least three times and the representative images were presented. Bars with different letters are significantly different from each other (p < 0.05).
Fig. 7
Fig. 7. ERBB3 and HBEGF are required for YAP to regulate ovarian cell proliferation
a) HBEGF and NRG1β1 stimulate proliferation of TOV21G cells; b) HBEGF and NRG1β1stimulate proliferation of KGN cells; c) HBEGF and NRG1β1 stimulate the growth of HOSE cell in a 3D hanging drop culture system. The diameter of the well ring is 1mm. d) Ki67 staining (green) in the control, HBEGF-treated and NRG1β1-treated microtissues derived from HOSE cell lines. Nuclei was stained with DAPI (blue); actin was stained with rhodamin-phalloidin. Scale bar; 20μm. e) Knockdown of HBEGF and ERBB3 compromised YAP-stimulated HOSE cell proliferation. f) Knockdown of HBEGF and ERBB3 blocked YAP-stimulated TOV21G cancer cell proliferation. All experiments were repeated at least three times and the representative images were presented. Each bar in bar graphs represents mean ± SEM. Bars with different letters are significantly different from each other (p < 0.05).
Fig. 8
Fig. 8. ERBB3 and HBEGF are required for YAP to transform HOSE cells and enhance the anchorage-independent growth of TOV21G cells
a) Representative images showing colony formation in HOSE-MXIV, HOSE-YAP and HOSE-YAPS127A cells before and after knockdown of ERBB3 and HBEGF with siRNAs. Scale bar: 500 μm. b) Quantitative data showing changes of colony formation in HOSE-MXIV, HOSE-YAP and HOSE-YAPS127A cells before and after knockdown of ERBB3 and HBEGF with siRNAs. c) Representative images showing colony formation in TOV21G-MXIV, TOV21G-YAP & TOV21G-YAPS127A cells before and after knockdown of ERBB3 and HBEGF with siRNAs. d) Quantitative data showing changes of colony formations in TOV21G-MXIV, TOV21G-YAP & TOV21G-YAPS127A cells before and after knockdown of ERBB3 and HBEGF with siRNAs. Each bar represents mean ± SEM (n=3). Bars with different letters are significantly different from each other (p < 0.05).
Fig. 9
Fig. 9. The Hippo/YAP and the ERBB pathways interact with each other to regulate normal and cancerous ovarian cell growth
a) Representative Western blots showing that HBEGF and NRG1 rapidly suppress the Hippo pathway and activate YAP by dephosphorylating LAST1/2, MOB1 and YAP in TOV21G ovarian cancer cells. β-actin was used as a loading control. b) Knockdown of ERBB3 with ERBB3 siRNA (siERBB3), or knockdown of HBEGF with HBEGF siRNA (siHBEGF), blocks YAP-stimulated growth of spheroids derived from HOSE cell lines; c) Knockdown of YAP with YAP siRNA (si-YAP) totally blocked HBEGF and NRG1 induced proliferation of TOV21G cells. d) Knockdown of YAP with YAP siRNA (si-YAP) totally blocked HBEGF- and NRG1-induced proliferation of KGN cells. Experiments are repeated three times and representative images were presented. Each bar in bar graphs represents mean ± SEM (n=3). Bars with different letters are significantly different from each other (p < 0.05).
Fig. 10
Fig. 10
A schematic diagram showing the proposed signaling pathway underlying the regulation of ovarian cancer progression by HBEGF/EGFR/YAP/HBEGF and NRG1/ERBB3/YAP/NRG1positive feedback autocrine loops.

References

    1. Siegel R, Desantis C, Jemal A. Colorectal cancer statistics, 2014. CA Cancer J Clin. 2014;64:104–117. - PubMed
    1. Bast RC, Jr, Hennessy B, Mills GB. The biology of ovarian cancer: new opportunities for translation. Nat Rev Cancer. 2009;9:415–428. - PMC - PubMed
    1. Justice RW, Zilian O, Woods DF, Noll M, Bryant PJ. The Drosophila tumor suppressor gene warts encodes a homolog of human myotonic dystrophy kinase and is required for the control of cell shape and proliferation. Genes Dev. 1995;9:534–546. - PubMed
    1. Xu T, Wang W, Zhang S, Stewart RA, Yu W. Identifying tumor suppressors in genetic mosaics: the Drosophila lats gene encodes a putative protein kinase. Development. 1995;121:1053–1063. - PubMed
    1. Pan D. The hippo signaling pathway in development and cancer. Dev Cell. 2010;19:491–505. - PMC - PubMed

Publication types