. 2015 Mar 23;10(3):e0121137.
doi: 10.1371/journal.pone.0121137. eCollection 2015.

Ecological and geographical analysis of the distribution of the mountain tapir (Tapirus pinchaque) in Ecuador: importance of protected areas in future scenarios of global warming

Affiliations

Ecological and geographical analysis of the distribution of the mountain tapir (Tapirus pinchaque) in Ecuador: importance of protected areas in future scenarios of global warming

H Mauricio Ortega-Andrade et al. PLoS One. .

Abstract

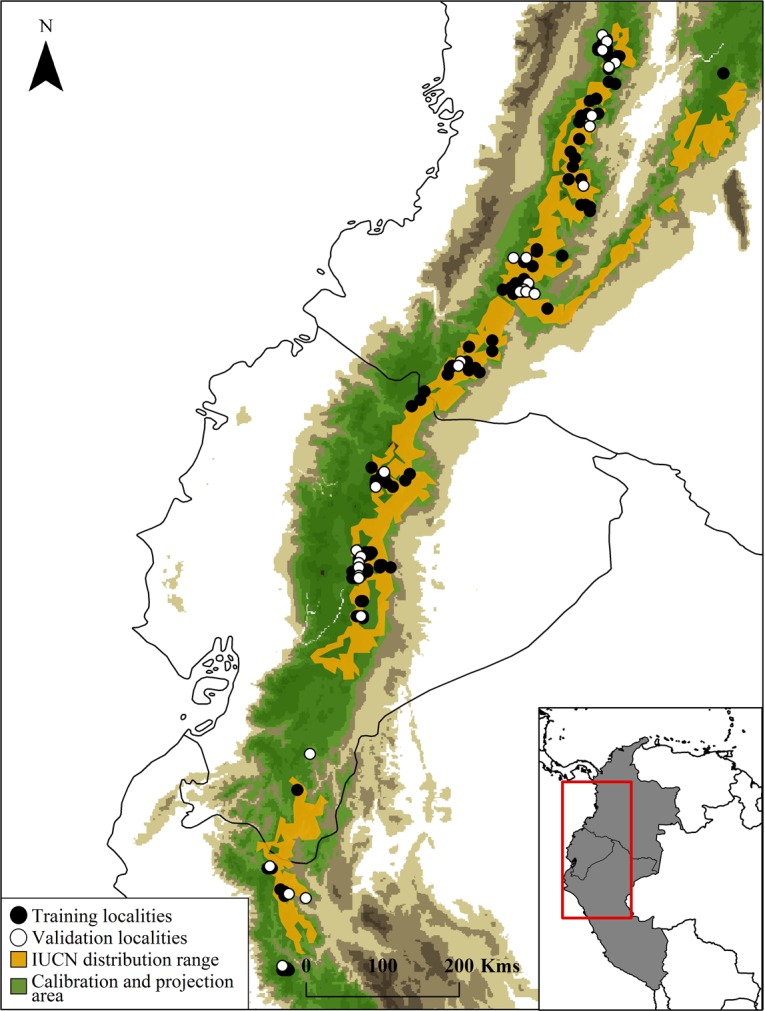
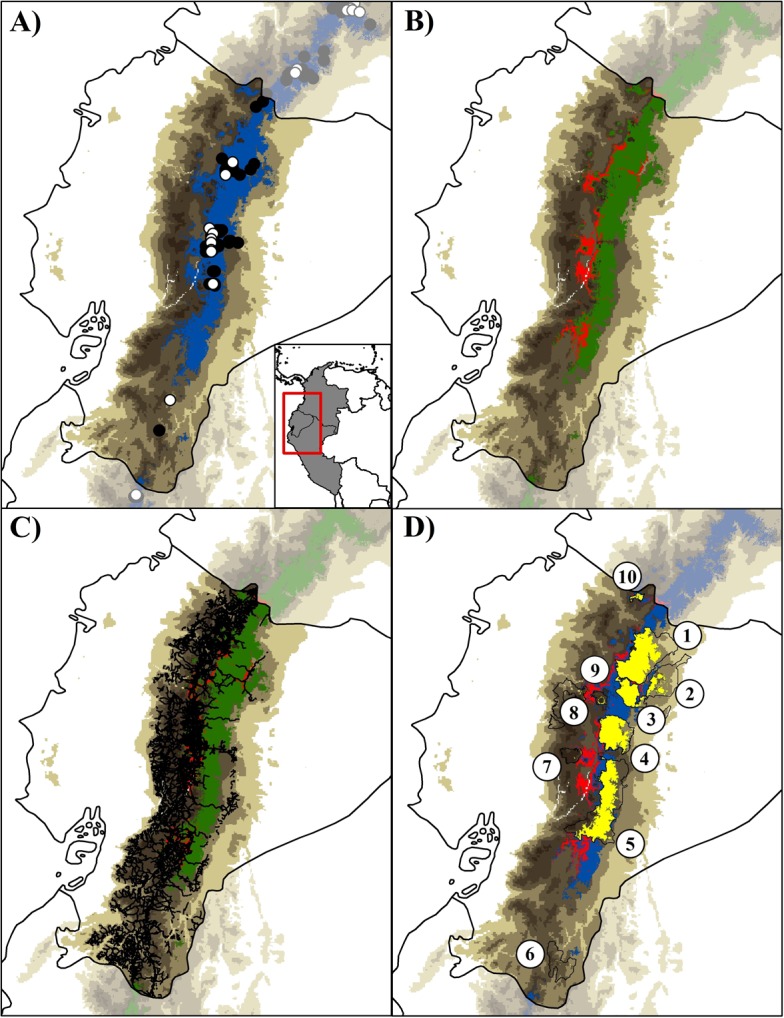
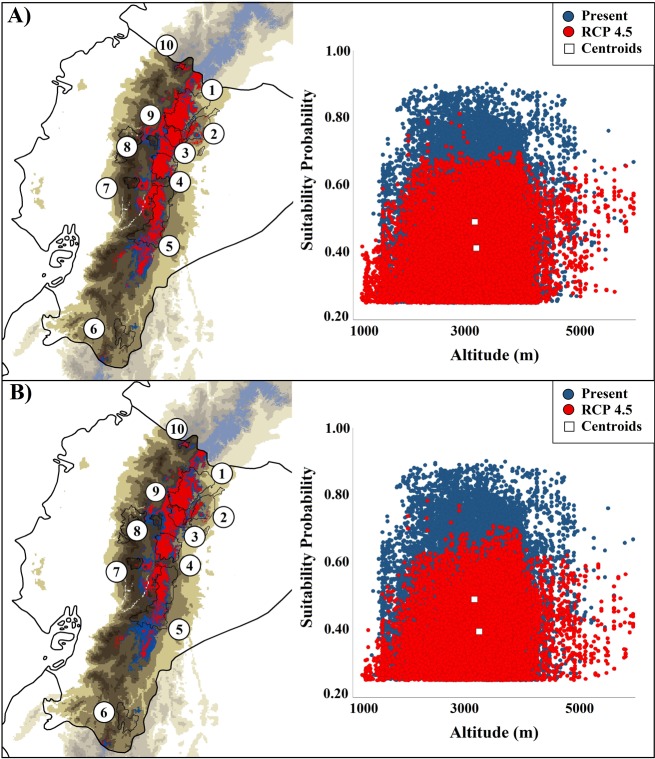
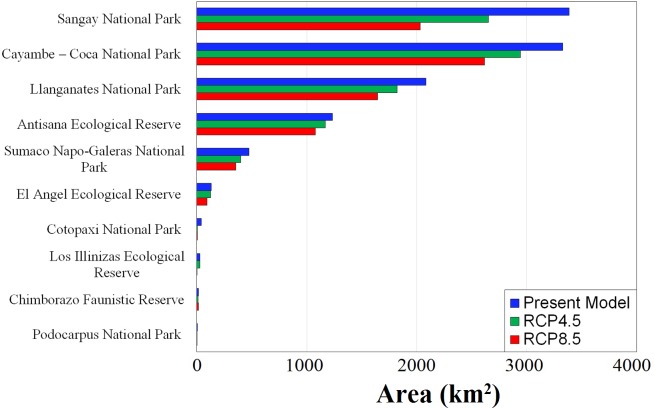
In Ecuador, Tapirus pinchaque is considered to be critically endangered. Although the species has been registered in several localities, its geographic distribution remains unclear, and the effects of climate change and current land uses on this species are largely unknown. We modeled the ecological niche of T. pinchaque using MaxEnt, in order to assess its potential adaptation to present and future climate change scenarios. We evaluated the effects of habitat loss due by current land use, the ecosystem availability and importance of Ecuadorian System of Protected Areas into the models. The model of environmental suitability estimated an extent of occurrence for species of 21,729 km2 in all of Ecuador, mainly occurring along the corridor of the eastern Ecuadorian Andes. A total of 10 Andean ecosystems encompassed ~98% of the area defined by the model, with herbaceous paramo, northeastern Andean montane evergreen forest and northeastern Andes upper montane evergreen forest being the most representative. When considering the effect of habitat loss, a significant reduction in model area (~17%) occurred, and the effect of climate change represented a net reduction up to 37.86%. However, the synergistic effect of both climate change and habitat loss, given current land use practices, could represent a greater risk in the short-term, leading to a net reduction of 19.90 to 44.65% in T. pinchaque's potential distribution. Even under such a scenarios, several Protected Areas harbor a portion (~36 to 48%) of the potential distribution defined by the models. However, the central and southern populations are highly threatened by habitat loss and climate change. Based on these results and due to the restricted home range of T. pinchaque, its preference for upland forests and paramos, and its small estimated population size in the Andes, we suggest to maintaining its current status as Critically Endangered in Ecuador.


Conflict of interest statement

Competing Interests: The authors have declared that no competing interests exist.

Figures

Fig 1
Fig 1. Map showing Mountain Tapir (Tapirus pinchaque) unique records (n = 155), overlaid with IUCN distribution and MaxEnt calibration and projection area.
Training localities (black dots) and validation localities (white dots) used to generate and validate the models. Dark brown color represents area with altitudes of up 1,000 masl.
Fig 2
Fig 2. Potential distribution model of Tapirus pinchaque in Ecuador.
(A) Potential distribution model is shown with the threshold value of Fixed Omission Value 10 (FOV10, dark blue); (B and C) Remnant potential distribution model with natural forests (green areas), perturbed areas (red) and principal roads in Andes of Ecuador (black lines); (D) Remnant potential distribution model predicted for Protected Areas of Ecuador (yellow areas bordered by black) and perturbed areas (red). Training localities (black dots) and validation localities (white dots) used to generate models are shown in (A). Numbers in (D) correspond to: Cayambe—Coca National Park (1); Sumaco Napo-Galeras National Park (2); Antisana Ecological Reserve (3); Llanganates National Park (4); Sangay National Park (5); Podocarpus National Park (6); Chimborazo Faunistic Reserve (7); Los Illinizas Ecological Reserve (8); Cotopaxi National Park (9); and El Angel Ecological Reserve (10). Note an important reduction (~17%, in green) in the western Andes of the best-predicted potential distribution model (FOV10 threshold) when filtered to only include areas of natural forests (B), and a reduction of 52% when it was filtered to only include Protected Areas in Ecuador (D). Dark brown color represents area with altitudes of up 1,000 masl. The model was generated with the no-correlated environmental variables (Table 1).
Fig 3
Fig 3. Potential ecological niche model of Tapirus pinchaque in two future scenarios of climate change based on the Global Climate Models of ACCESS 1.0.
Potential ecological niche model for the year 2050, under (A) RCP 4.5 (optimistic) and (B) RCP 8.5 (pessimistic) climatic change scenarios. Numbers correspond to those referred to for Protected Areas estimation in Fig. 1. Note a reduction (~22–38%, in red) of the best-predicted potential distribution model (FOV10 threshold). In both scenarios, suitability areas for Tapirus pinchaque tend to critically reduce, especially in the southern regions. Shifts are depicted from their centroids in the ecological niche-space.
Fig 4
Fig 4. The role of Protected Areas in two future scenarios of climate change (based in ACCESS 1.0).
Potential distribution model in the year 2050, under RCP 4.5 (optimistic) and RCP 8.5 (pessimistic) climatic change scenarios. In both scenarios, we observed a reduction in the predicted geographic range for Tapirus pinchaque.
Fig 5
Fig 5. Generalized Additive Models (A-C) and scatter plot for the relation between suitability probability and altitude, in climate change scenarios (D).
Non-parametric smoothers in GAM showing the multiple humped relationship between suitability probability and altitude, highlighting the possibility of minimum thresholds of altitude over ≈ 3,000 m (A-C). The etchings (small black lines) on the x axis in GAMs (A-C) indicate the density of probabilistic values located along the altitude, whereas centroids for the scattered data are represented as squares in (D).

References

    1. Roulin X (1829) Mémoire pour servir á l’histoire du tapir; et description d’une espéce nouvelle appartenant aux hautes régions de la Cordillére des Andes. Annales des Sciences Naturelle Zoologie Paris 17: 26–55.
    1. Lizcano D, Pizarro V, Cavelier J, Carmona J (2002) Geographic distribution and population size of the mountain tapir (Tapirus pinchaque) in Colombia. Journal of Biogeography 29: 7–15.
    1. Padilla M, Dowler RC, Dowler CC (2010) Tapirus pinchaque (Perissodactyla: Tapiridae). Mammalian species 42: 166–182.
    1. Isaac NJ, Turvey ST, Collen B, Waterman C, Baillie JE (2007) Mammals on the EDGE: conservation priorities based on threat and phylogeny. PLoS One 2: e296 - PMC - PubMed
    1. Schauenberg P (1969) Contribution à l'étude du Tapir pinchaque, Tapirus pinchaque Roulin 1829. Revue Suisse de zoologie 76: 211–256.

Publication types

LinkOut - more resources